CNC Condition Monitoring
Reading a Three-Axis CNC Frequency Spectrum
Compare X, Y and Z spectra from the same OP03 record and connect peaks with process frequencies responsibly.
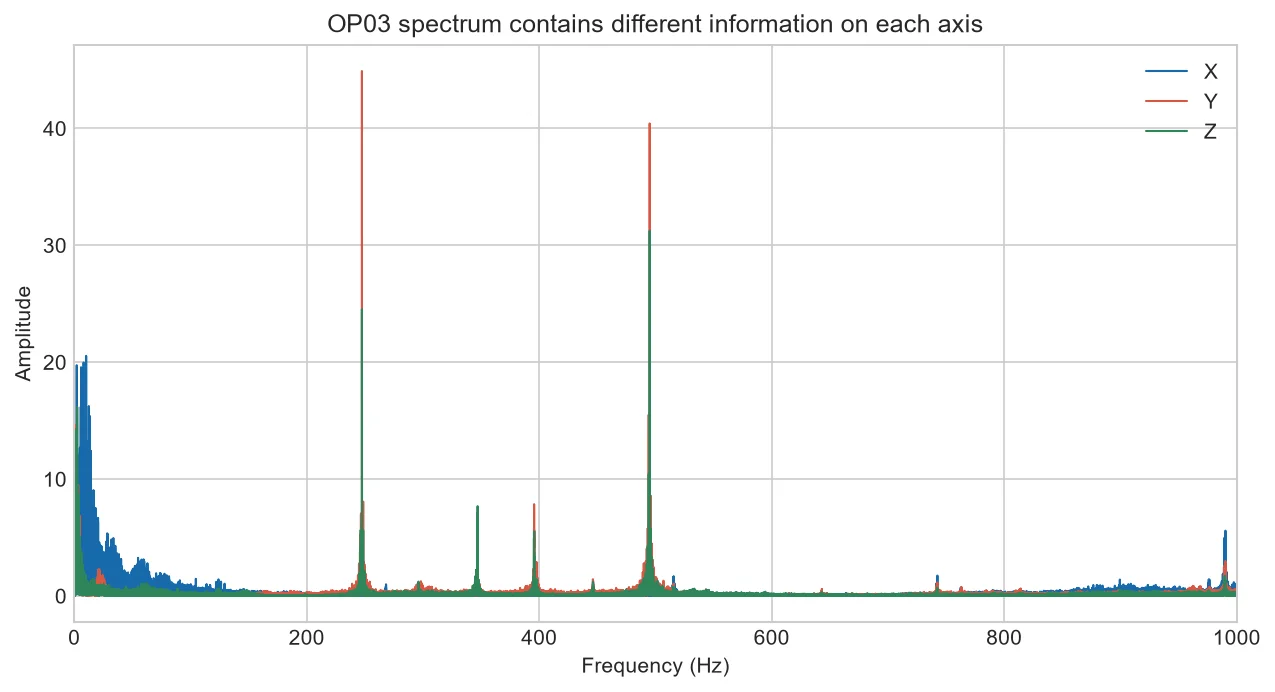
A tri-axial spectrum shows that frequency content is directional. A peak strong on X may be small on Z because forces and structural response travel differently.
Build comparable spectra
Use the same time segment, detrending, window function and normalization for all axes.
Read frequency and direction together
A shared peak suggests a common excitation; an axis-specific peak may reflect directional response or mounting.
Calculate expected frequencies
Convert rpm to Hz and multiply by tooth count where appropriate. Check harmonics and sidebands rather than guessing.
Trend bands, preserve spectra
Band features are easy to monitor, but save representative spectra for investigation.
From spindle speed to a hypothesis
At 6,000 rpm, rotation is 100 Hz. A four-flute tool has nominal tooth passing at 400 Hz. Mark those positions before reviewing measured peaks.
If a peak moves with commanded speed, it is more likely speed-related than a fixed structural or electrical frequency. Confirm with controlled runs.
| Clue | Possible follow-up |
| Peak follows rpm | Rotational source |
| Peak follows flute count | Cutting engagement |
| Fixed frequency | Structure, drive or acquisition source |
Common mistakes to avoid
- Comparing axes with different scales unnoticed.
- Naming a bearing fault from one line.
- Ignoring frequency resolution.
Frequently asked questions
Why are axes different?
Direction, stiffness and mounting alter response.
Should spectra use dB?
Either scale works if clearly labeled and consistent.
Can frequency identify the source?
It narrows hypotheses but needs operating context.
Practical workflow for this method
Create an order-based view when speed varies so rotational components can be compared in multiples of speed.
Verify sensor bandwidth before interpreting peaks near the measurement limit.
Average spectra only across aligned, comparable states. Averaging unrelated speeds smears rotational peaks and may represent no real condition.
For variable speed, record speed with vibration and consider order tracking so rotational components remain comparable.
Frequency resolution is approximately one divided by record duration. A two-second segment gives about 0.5 Hz spacing, while a five-second segment gives about 0.2 Hz. This describes bin spacing; it does not remove leakage or guarantee that closely spaced physical components are distinguishable.
List expected rotational and cutting frequencies before reading peaks. Record spindle rpm, flute count and any known drive frequencies. Then compare peak movement across controlled speeds. A component tied to rpm should move predictably, providing stronger evidence than one static spectrum.
About the data used in this guide
The charts use a small teaching sample selected from machines M01, M02 and M03, primarily operations OP03 and OP04. The source records tri-axial acceleration at 2 kHz and labels available examples as good or bad. Label coverage is uneven across machine-operation groups, so missing groups are not treated as healthy evidence. These figures are transparent worked examples, not population estimates or universal fault thresholds.
Dataset: CNC Machining Data, CC BY 4.0. Recommended citation: Tnani, Mohamed-Ali; Feil, Michael; Diepold, Klaus. Smart Data Collection System for Brownfield CNC Milling Machines: A New Benchmark Dataset for Data-Driven Machine Monitoring. Procedia CIRP 107 (2022), 131–136. Research paper.
We explain what the selected data supports and avoid naming a mechanical fault when the dataset only provides a good/bad process label. A machine should be inspected by a qualified person before maintenance or safety decisions are made.


