CNC Condition Monitoring
Frequency-Band Energy for CNC Monitoring
Turn a detailed spectrum into explainable low-, mid- and high-frequency features without losing physical meaning.
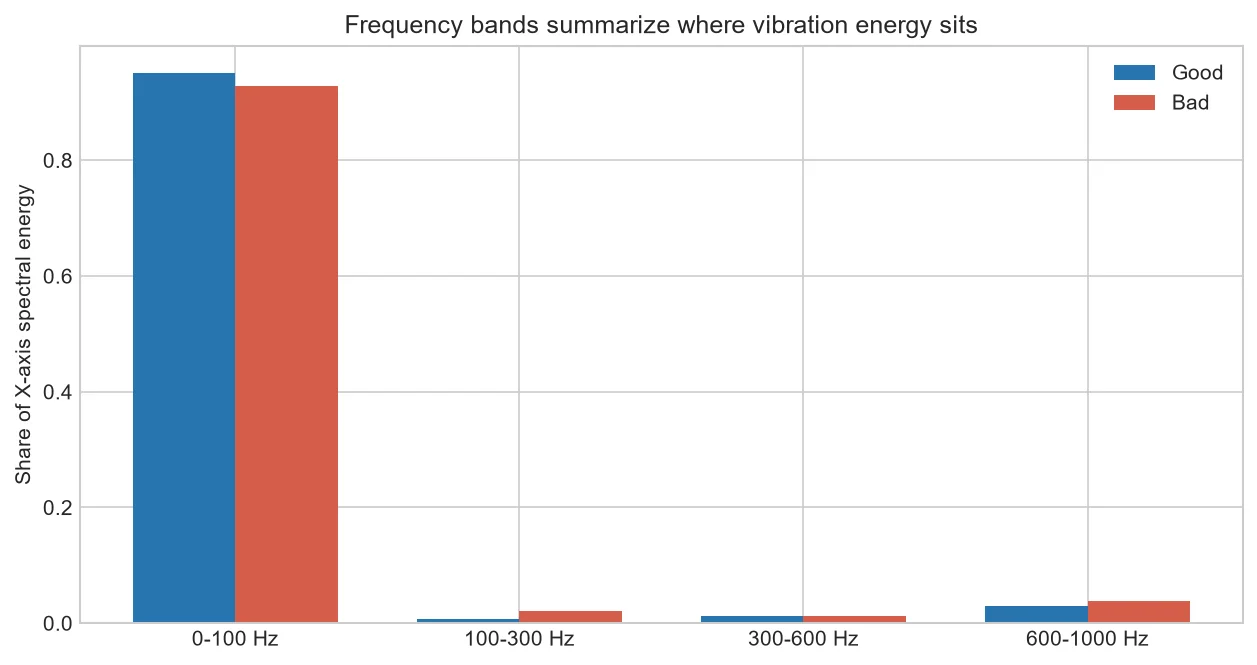
A spectrum may contain thousands of bins. Band energy combines selected bins into a smaller set of features that can be trended and explained.
How a band is calculated
Square spectral amplitude or use a consistent power estimate, then sum or integrate values between defined frequencies.
Why use energy shares
Dividing by total energy emphasizes distribution. Keep absolute band energy too because shares can change when another band grows.
Choose boundaries carefully
Round bands are useful for teaching, but production bands should reflect rotation, tooth passing, resonances or validated model needs.
Avoid hidden processing changes
Window, overlap and normalization must be versioned with the feature.
Design a band feature
Calculate expected process frequencies, inspect healthy spectra across several cycles and define a band wide enough to tolerate normal speed variation.
Trend both absolute band RMS and its share of total spectrum. Review changes with speed, tool and part-quality data.
| Feature | Strength | Limitation |
| Absolute band energy | Shows scale | Affected by overall load |
| Energy share | Shows distribution | Can move indirectly |
| Peak in band | Simple | Sensitive to one bin |
Common mistakes to avoid
- Choosing bands after viewing test labels.
- Overlapping bands without documentation.
- Using arbitrary boundaries as fault labels.
Frequently asked questions
How many bands are needed?
Start small and add only bands with stable value.
Can bands overlap?
Yes, if intentional and documented.
Do bands replace FFT plots?
No; spectra remain useful for investigation.
Practical workflow for this method
Test band stability across healthy dates before using anomaly separation as evidence.
If spindle speed varies, consider order tracking or speed-adjusted band locations.
Estimate repeatability of each band across healthy cycles. A naturally unstable band creates poor alerts even if one chart looks separated.
Version every band definition: edges, spectrum method, window, normalization and units. A name without settings is not reproducible.
For discrete spectra, a consistent teaching calculation sums squared magnitudes inside each frequency mask. Production work should define amplitude normalization and whether the result is energy, power spectral density or band RMS. These terms are related but not interchangeable.
Test the band under small normal speed changes. If the target component moves outside a narrow fixed band, widen it, follow speed with an order-based band, or use a peak-tracking method. A feature must tolerate expected operation while remaining sensitive to relevant change.
About the data used in this guide
The charts use a small teaching sample selected from machines M01, M02 and M03, primarily operations OP03 and OP04. The source records tri-axial acceleration at 2 kHz and labels available examples as good or bad. Label coverage is uneven across machine-operation groups, so missing groups are not treated as healthy evidence. These figures are transparent worked examples, not population estimates or universal fault thresholds.
Dataset: CNC Machining Data, CC BY 4.0. Recommended citation: Tnani, Mohamed-Ali; Feil, Michael; Diepold, Klaus. Smart Data Collection System for Brownfield CNC Milling Machines: A New Benchmark Dataset for Data-Driven Machine Monitoring. Procedia CIRP 107 (2022), 131–136. Research paper.
We explain what the selected data supports and avoid naming a mechanical fault when the dataset only provides a good/bad process label. A machine should be inspected by a qualified person before maintenance or safety decisions are made.


