CNC Condition Monitoring
OP03 Vibration Across Three CNC Machines
Compare healthy OP03 vibration on M01, M02 and M03 without confusing a different baseline with worse condition.
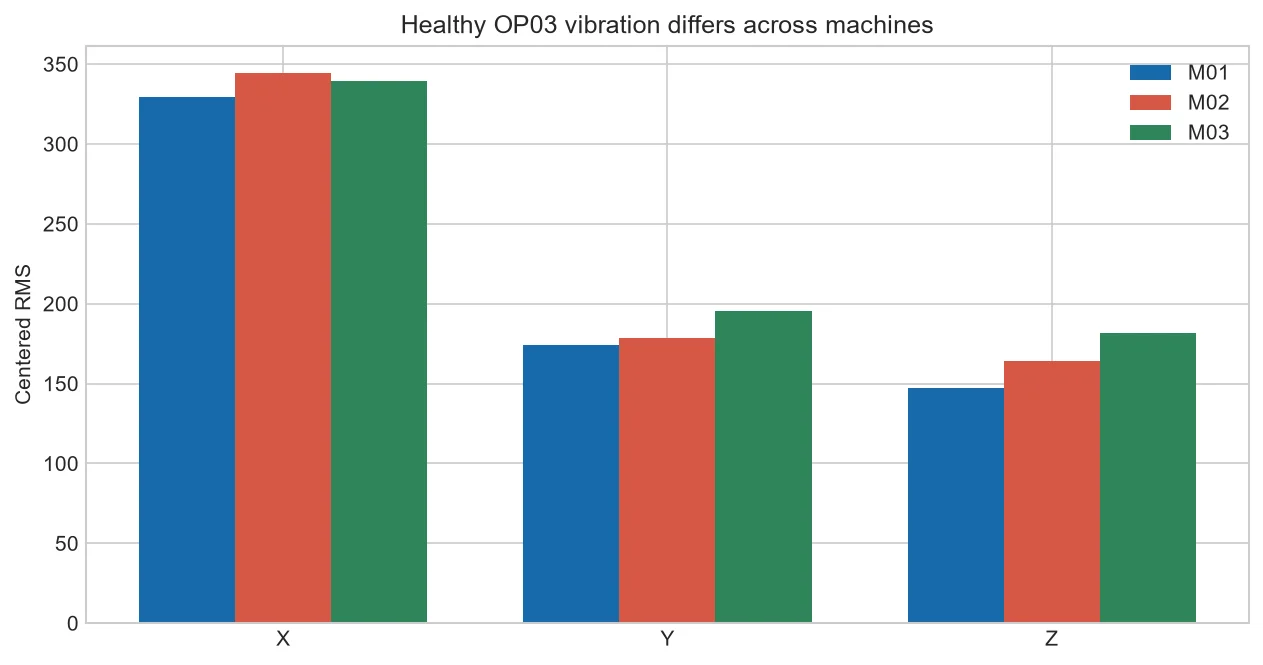
OP03 gives us another chance to test a lesson from OP01: machine identity matters. The bars differ by machine and axis even though every selected file carries a healthy label.
What is new in this comparison
This chart uses OP03 rather than OP01. Seeing machine differences in another operation strengthens the case for local baselines, although the small sample still prevents population claims.
Read one axis at a time
Compare M01, M02 and M03 within X, then Y, then Z. Do not rank machines by the tallest single bar because sensor coupling and structure affect scale.
Look for repeatable relationships
Ask whether the same machine remains relatively high or low across other operations. Stable machine signatures may need normalization; changing relationships may need operation-specific models.
Use inspection context
A feature difference becomes condition evidence only when matched with production and maintenance observations.
A practical cross-machine check
Calculate healthy means for OP03 on each machine, then express each new cycle as percentage change from its own mean. A 20 percent rise has a consistent interpretation even when raw baselines differ.
Plot raw values beside percentage change. If the relative alert rises while raw data looks ordinary, the engineering view can still trace the calculation.
| View | Purpose |
| Raw RMS | Reproduce the measurement |
| Local percentage change | Compare condition within a machine |
| Fleet summary | Prioritize review |
Common mistakes to avoid
- Ranking health from raw amplitudes.
- Mixing OP01 and OP03 reference files.
- Ignoring mount changes.
Frequently asked questions
Does the chart prove machine wear?
No. It demonstrates baseline differences in selected files.
Can OP01 limits be reused?
Not without validating OP03 behavior.
Why keep raw values?
They preserve engineering traceability.
Practical workflow for this method
Collect more healthy OP03 cycles across dates and tool states before setting limits. Plot distributions rather than only means.
If a fleet model is planned, hold out one entire machine and test whether machine-specific normalization improves performance without leaking test data.
Use confidence bands when more files become available. Means alone hide spread, so two machines with different averages may still overlap heavily. Show individual points or percentiles beside the fleet summary.
Repeat the comparison after a known maintenance event. If a machine baseline moves while inspections remain healthy, version the reference rather than forcing it toward the old fleet level.
For each machine, calculate the healthy median and an interval such as the 10th to 90th percentile once enough files are available. For a new cycle, report raw RMS, percentage change from the median, and whether it falls outside the interval. This produces an alert that an operator can understand without hiding the original measurement.
Do not pool machines merely to increase sample count. First test whether machine identity explains a large part of feature variation. If it does, use local references or include machine identity explicitly in the model and validate on a held-out machine.
About the data used in this guide
The charts use a small teaching sample selected from machines M01, M02 and M03, primarily operations OP03 and OP04. The source records tri-axial acceleration at 2 kHz and labels available examples as good or bad. Label coverage is uneven across machine-operation groups, so missing groups are not treated as healthy evidence. These figures are transparent worked examples, not population estimates or universal fault thresholds.
Dataset: CNC Machining Data, CC BY 4.0. Recommended citation: Tnani, Mohamed-Ali; Feil, Michael; Diepold, Klaus. Smart Data Collection System for Brownfield CNC Milling Machines: A New Benchmark Dataset for Data-Driven Machine Monitoring. Procedia CIRP 107 (2022), 131–136. Research paper.
We explain what the selected data supports and avoid naming a mechanical fault when the dataset only provides a good/bad process label. A machine should be inspected by a qualified person before maintenance or safety decisions are made.


