CNC Condition Monitoring
Directional CNC Vibration: Comparing X, Y and Z
Use relative axis energy to compare vibration direction without letting one machine’s raw amplitude dominate.
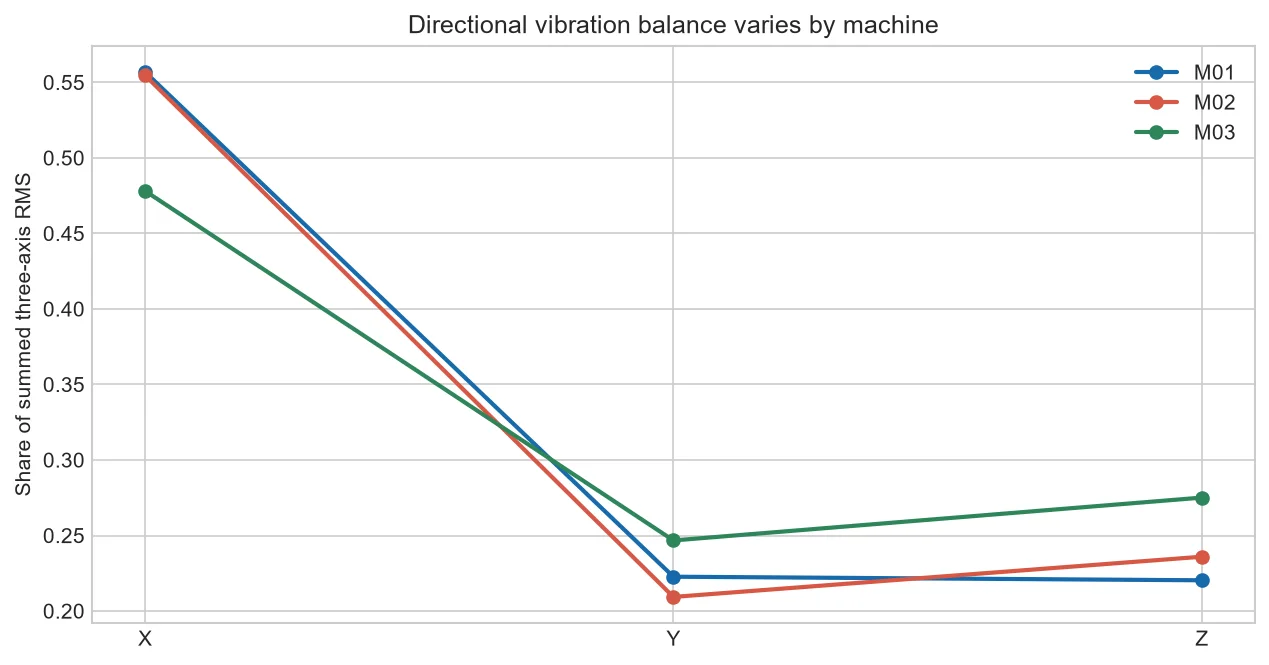
Sometimes direction matters more than total amplitude. Converting each axis RMS into a share of the three-axis sum reveals how measured energy is distributed.
What normalization shows
Dividing each axis RMS by the three-axis sum removes overall scale and emphasizes balance. It cannot replace raw values because a quiet and a severe event can have the same proportions.
Structural meaning
The balance reflects cutting direction, stiffness, resonances and sensor placement. Interpret it with the toolpath and machine layout.
Useful trend
Track raw RMS and axis shares together. An overall rise with stable shares differs from one axis taking a larger portion.
Common limitation
If the sensor is rotated, the balance can change without any machine event. Orientation records are essential.
Use proportions and raw values together
If X, Y and Z RMS are 400, 200 and 200, X carries 50 percent of the summed RMS. If all three double, the proportions stay the same while severity changes.
A dashboard should therefore plot total or raw RMS beside directional shares. One shows scale; the other shows balance.
| Change | Possible reading |
| Raw values rise, shares stable | Broad increase |
| One share rises | Directional change |
| Shares change after remounting | Measurement setup change |
Common mistakes to avoid
- Using shares without raw amplitude.
- Treating percentages as independent.
- Forgetting sensor orientation.
Frequently asked questions
Do shares add to 100 percent?
Yes when defined as each axis divided by the three-axis sum.
Is vector magnitude better?
It answers a different question and loses directional detail.
Can axis balance detect looseness?
It may change, but inspection is needed to identify the cause.
Practical workflow for this method
Read the directional-share chart as a composition. If X carries half of the summed RMS, Y and Z must share the remaining half. The three percentages are therefore linked; an increase in one forces at least one other share down even when its raw amplitude stays constant.
Build a two-panel trend: raw RMS by axis on top and axis shares below. An overall load increase may lift all raw values while leaving the shares stable. A fixture or directional-force change may alter the shares more clearly. This paired view avoids confusing scale with direction.
After any sensor remounting, collect a short healthy verification set. Compare both raw values and proportions with the previous setup. If orientation changed, begin a new baseline version instead of attempting to hide the change through normalization.
About the data used in this guide
The charts use a small teaching sample selected from machines M01, M02 and M03, primarily operations OP01 and OP02. The source records tri-axial acceleration at 2 kHz and labels available examples as good or bad. Label coverage is uneven across machine-operation groups, so missing groups are not treated as healthy evidence. These figures are transparent worked examples, not population estimates or universal fault thresholds.
Dataset: CNC Machining Data, CC BY 4.0. Recommended citation: Tnani, Mohamed-Ali; Feil, Michael; Diepold, Klaus. Smart Data Collection System for Brownfield CNC Milling Machines: A New Benchmark Dataset for Data-Driven Machine Monitoring. Procedia CIRP 107 (2022), 131–136. Research paper.
We explain what the selected data supports and avoid naming a mechanical fault when the dataset only provides a good/bad process label. A machine should be inspected by a qualified person before maintenance or safety decisions are made.


