CNC Condition Monitoring
FFT for CNC Vibration: From a Busy Waveform to a Useful Spectrum
A beginner-friendly guide to FFT, frequency peaks, windowing, resolution, and responsible interpretation of CNC spectra.
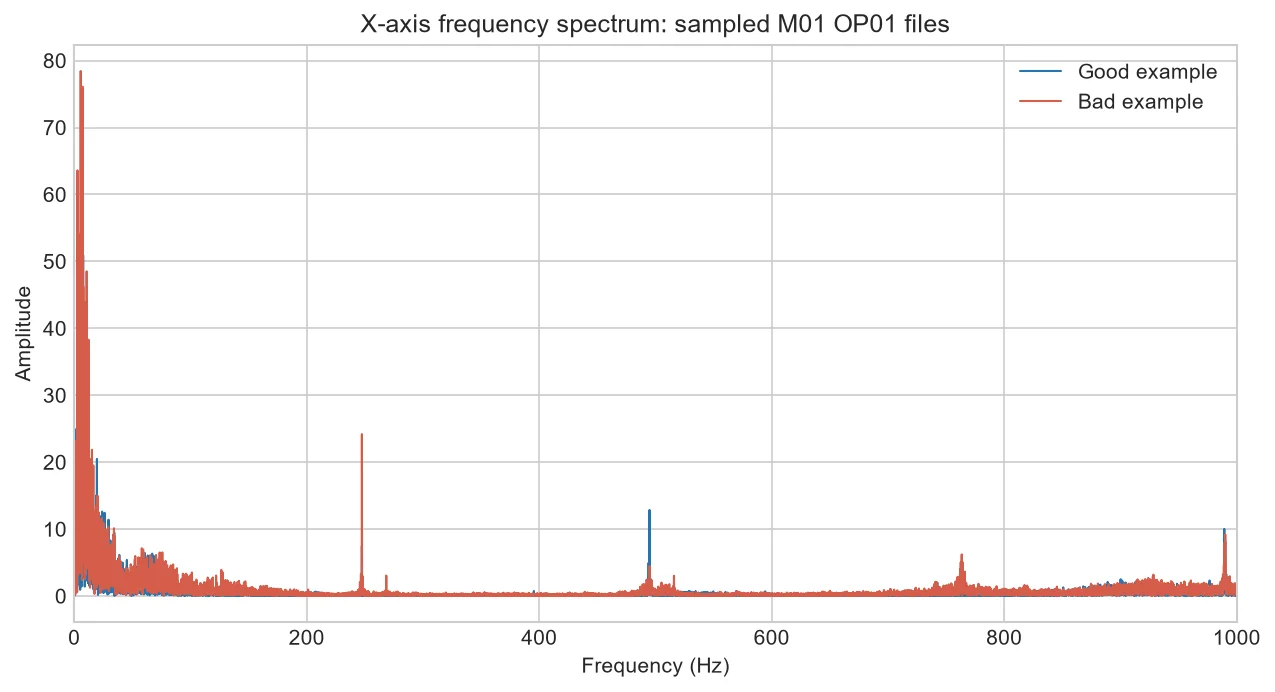
A waveform tells you when vibration happened. A frequency spectrum tells you how that vibration is distributed by frequency. The FFT is the calculation that makes this change of viewpoint possible.
Why frequency helps
Rotating components and repeating cutting events often produce periodic motion. Their frequencies—and multiples called harmonics—can form recognizable patterns. A spectrum separates overlapping patterns that look tangled in the waveform.
Prepare the signal consistently
Remove unwanted offset, select a time window, apply an appropriate window function, and use the same amplitude normalization. Frequency resolution depends on the duration of the selected segment, not only the sample rate.
Do not name a fault from one peak
A peak could relate to spindle rotation, tooth passing, structural resonance, a drive, or process modulation. Calculate expected frequencies from machine and process information, then look for consistent sidebands, harmonics, and trends.
Read the example as a comparison
The sample spectrum shows two labeled files with different shapes. It demonstrates the method, not a diagnostic rule. A reliable study would compare many matched cycles and relate changes to documented machine events.
Connecting a spectrum to machine speed
A spindle running at 6,000 rpm rotates at 100 revolutions per second, or 100 Hz. With a four-flute cutter, the nominal tooth-pass frequency is 400 Hz. Peaks near these frequencies may be expected during a stable cut, while harmonics and sidebands require context.
This calculation does not prove that every 400 Hz peak is tooth passing. Speed variation, structural resonance, other rotating sources and the measurement chain can shift or amplify the pattern. Use controller data and repeatable tests to confirm the relationship.
| Known quantity | Example | Calculated frequency |
| Spindle speed | 6,000 rpm | 100 Hz rotational frequency |
| Number of flutes | 4 | 400 Hz tooth-pass frequency |
| Sampling rate | 2,000 Hz | 1,000 Hz theoretical Nyquist limit |
Common mistakes to avoid
- Reading a frequency peak without knowing spindle speed.
- Comparing spectra created with different windows or normalization.
- Using too short a record for the required frequency resolution.
- Treating the largest spectral line as the fault.
Frequently asked questions
What is frequency resolution?
It is the spacing between FFT bins. For a basic transform it is approximately sample rate divided by record length in samples.
Why use a window function?
It reduces spectral leakage when the selected record does not contain an exact whole number of cycles.
Should I plot amplitude linearly or in decibels?
Either can work. Linear plots show dominant components clearly; decibels reveal smaller components. State the scale and use it consistently.
About the data used in this guide
The charts use selected files from machine M01, operation OP01. The source records tri-axial acceleration at 2 kHz and labels process examples as good or bad. Our initial charts use two files from each label. They are teaching examples, not universal fault thresholds.
Dataset: CNC Machining Data, CC BY 4.0. Recommended citation: Tnani, Mohamed-Ali; Feil, Michael; Diepold, Klaus. Smart Data Collection System for Brownfield CNC Milling Machines: A New Benchmark Dataset for Data-Driven Machine Monitoring. Procedia CIRP 107 (2022), 131–136. Research paper.
We explain what the selected data supports and avoid naming a mechanical fault when the dataset only provides a good/bad process label. A machine should be inspected by a qualified person before maintenance or safety decisions are made.


