CNC Condition Monitoring
Spectral Entropy for CNC Monitoring in Plain English
Learn how spectral entropy describes concentrated or distributed vibration energy and when it adds information beyond RMS.
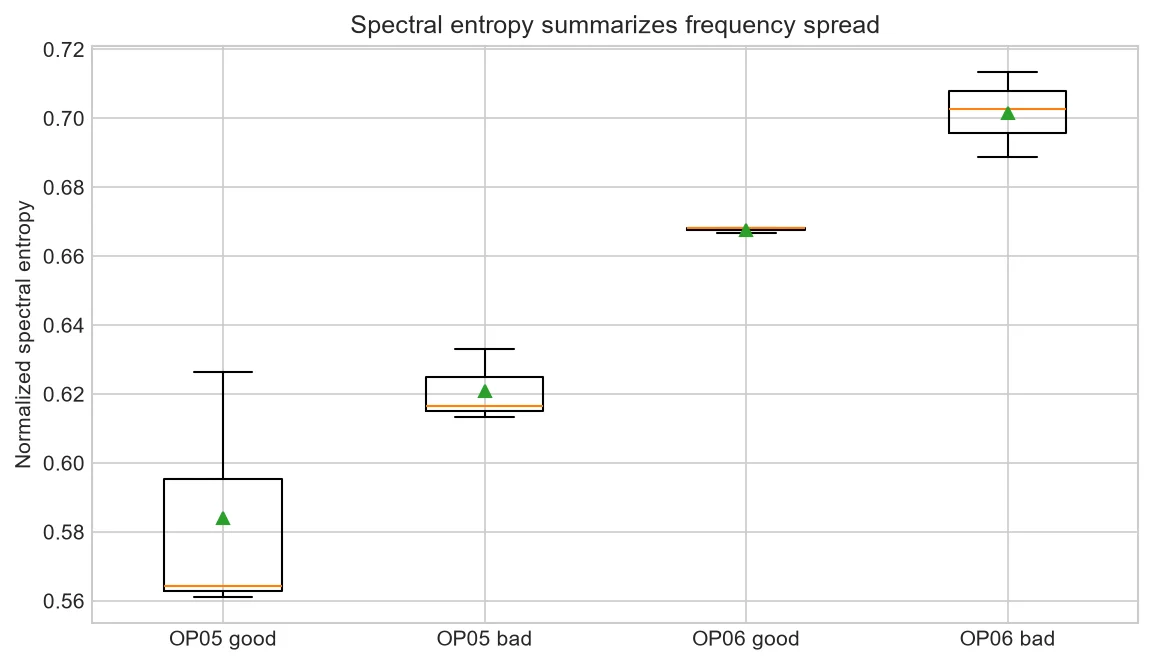
Spectral entropy reduces a frequency spectrum to a measure of how concentrated or spread out its energy is. A narrow set of dominant frequencies tends to produce lower entropy than a broad, flatter spectrum.
From spectrum to entropy
Calculate a power spectrum, normalize its bins so they behave like proportions, then summarize their disorder. Normalizing by the maximum possible entropy makes values easier to compare when bin counts match.
Why RMS is not enough
Two records can contain similar total energy but distribute it differently across frequencies. Entropy may expose that redistribution while RMS remains steady.
Why settings control the answer
Window function, segment length, overlap, frequency range and sampling rate change the spectrum and therefore the entropy. A threshold cannot travel safely between different pipelines.
Operational interpretation
A speed change can move or spread peaks without any degradation. Compare like-for-like states or use speed-aware analysis before calling an entropy change abnormal.
A two-dimensional review
Plot spectral entropy against RMS for healthy cycles. New points that move in entropy but not RMS suggest a spectral-shape change; points that move in both suggest shape and energy changed.
Open the underlying spectrum before acting. Entropy intentionally discards the location of individual peaks.
| Energy pattern | Typical entropy |
| Few dominant bins | Lower |
| Broadly distributed | Higher |
| Same distribution, larger scale | Similar |
Common mistakes to avoid
- Comparing different frequency ranges.
- Ignoring spindle speed.
- Treating entropy as a fault classifier by itself.
Frequently asked questions
Does high entropy mean noise?
It can, but broadband physical vibration can also be real.
Can entropy locate a peak?
No; retain the spectrum for that purpose.
Should DC be included?
Use a documented choice consistently; detrending is common for acceleration signals.
Practical workflow for this method
Calculate entropy within engineering frequency bands if whole-spectrum entropy hides a local redistribution.
Evaluate repeatability across healthy days. A feature with poor healthy stability is unlikely to support a trustworthy alert.
About the data used in this guide
The charts use a small teaching sample selected from machines M01, M02 and M03, primarily operations OP05 and OP06. The source records tri-axial acceleration at 2 kHz and labels available examples as good or bad. Label coverage is uneven across machine-operation groups, so missing groups are not treated as healthy evidence. These figures are transparent worked examples, not population estimates or universal fault thresholds.
Dataset: CNC Machining Data, CC BY 4.0. Recommended citation: Tnani, Mohamed-Ali; Feil, Michael; Diepold, Klaus. Smart Data Collection System for Brownfield CNC Milling Machines: A New Benchmark Dataset for Data-Driven Machine Monitoring. Procedia CIRP 107 (2022), 131–136. Research paper.
We explain what the selected data supports and avoid naming a mechanical fault when the dataset only provides a good/bad process label. A machine should be inspected by a qualified person before maintenance or safety decisions are made.


