CNC Condition Monitoring
What Skewness Reveals in a CNC Vibration Waveform
Use skewness to check waveform asymmetry while separating sensor offset, clipping and process effects from machine condition.
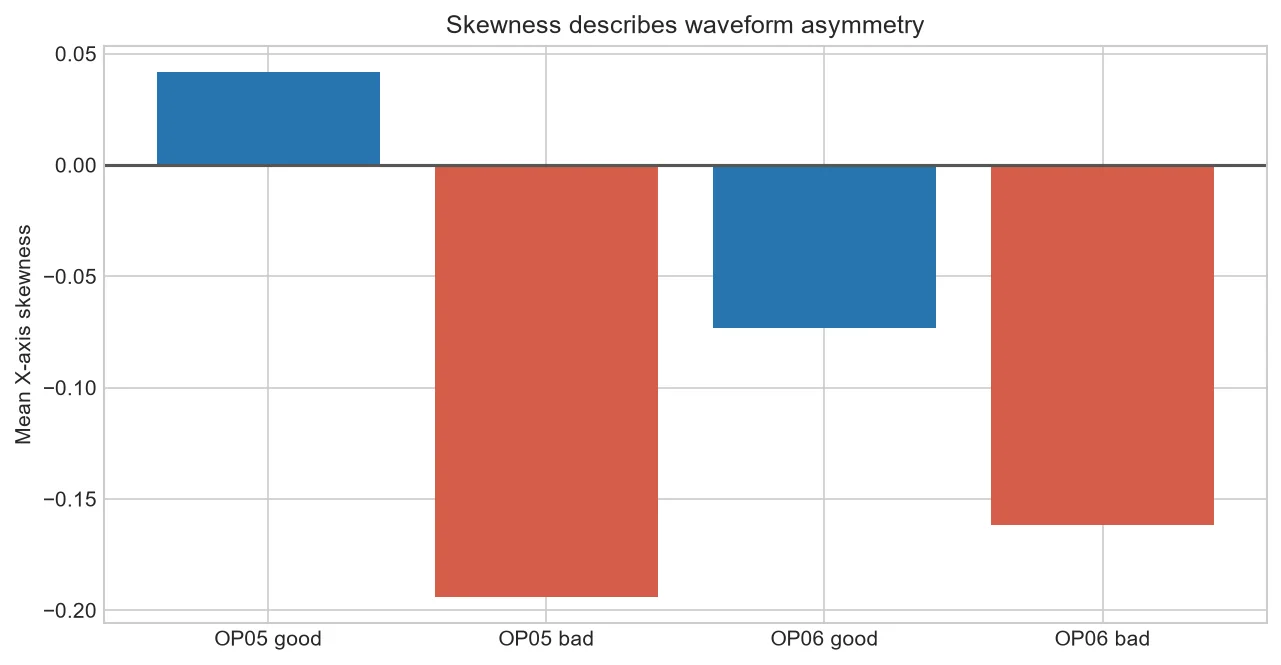
Skewness measures asymmetry around a signal's mean. A balanced acceleration waveform tends toward zero, while repeated stronger excursions in one direction can move the value positive or negative.
Why asymmetry may appear
Direction-dependent impacts, gravity projection, mounting, electrical offset and clipping can all change skewness. The statistic cannot distinguish these causes without other evidence.
Orientation changes the sign
Rotating an accelerometer axis can reverse polarity. A sign change after remounting may be measurement geometry rather than machine behavior.
Check the distribution
Pair the number with a histogram and raw trace. A broad one-sided shift looks different from a single extreme sample even if both affect skewness.
Make it operational
Trend skewness only within the same phase and axis definition. Add data-quality flags for constant offset, clipping and orientation changes.
Investigate a sudden sign change
First compare sensor metadata and maintenance logs. Then plot centered raw data and count samples near the measurement limits.
If the sign changed after remounting but RMS and spectral shape stayed stable, establish the corrected orientation or version the baseline.
| Observation | First check |
| Large steady skew | Offset and orientation |
| Single extreme tail | Impact or electrical spike |
| Flat edge in histogram | Clipping |
Common mistakes to avoid
- Comparing opposite sensor orientations.
- Skipping centering and quality checks.
- Equating positive or negative sign with severity.
Frequently asked questions
Is zero skewness always healthy?
No. Many abnormal signals can still be symmetric.
Does axis sign matter?
It matters for interpretation and must be consistent.
Can skewness replace RMS?
No; it describes shape rather than energy.
Practical workflow for this method
Use robust distribution plots by operation phase to show whether the mean statistic represents most cycles.
Record axis conventions in the acquisition manifest so future remounts can be audited instead of silently shifting baselines.
About the data used in this guide
The charts use a small teaching sample selected from machines M01, M02 and M03, primarily operations OP05 and OP06. The source records tri-axial acceleration at 2 kHz and labels available examples as good or bad. Label coverage is uneven across machine-operation groups, so missing groups are not treated as healthy evidence. These figures are transparent worked examples, not population estimates or universal fault thresholds.
Dataset: CNC Machining Data, CC BY 4.0. Recommended citation: Tnani, Mohamed-Ali; Feil, Michael; Diepold, Klaus. Smart Data Collection System for Brownfield CNC Milling Machines: A New Benchmark Dataset for Data-Driven Machine Monitoring. Procedia CIRP 107 (2022), 131–136. Research paper.
We explain what the selected data supports and avoid naming a mechanical fault when the dataset only provides a good/bad process label. A machine should be inspected by a qualified person before maintenance or safety decisions are made.


