CNC Condition Monitoring
How to Normalize CNC Vibration Features Without Hiding the Signal
Compare raw features with machine-centered values and learn when normalization helps or harms condition monitoring.
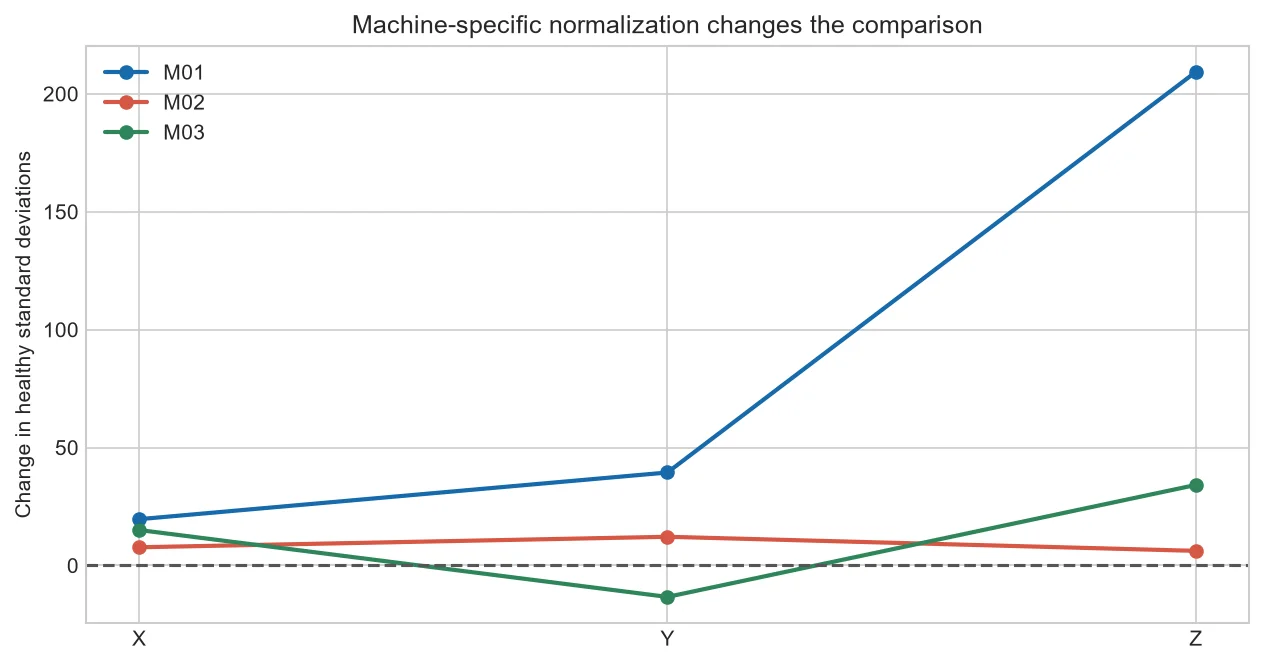
Normalization changes the question from “How large is this value?” to “How unusual is it for this reference?” That can make machines comparable, but a poor reference can magnify noise.
Why normalize
Raw RMS scale may be dominated by mounting and machine identity. Centering by a machine baseline highlights relative change.
Avoid data leakage
If test or anomalous records help calculate the mean and spread, evaluation is contaminated. Fit preprocessing on the training reference only.
Robust alternatives
Median and median absolute deviation can be less sensitive to extreme healthy values than mean and standard deviation.
Keep two views
Show normalized condition for fleet comparison and raw engineering units for troubleshooting. Each answers a different question.
Standardization with a healthy reference
For each machine, subtract the healthy mean and divide by healthy standard deviation. A result of +2 means two selected healthy standard deviations above the reference mean.
With only two healthy files, standard deviation is unstable. Our chart demonstrates the calculation, not a deployable score.
| Method | Strength | Caution |
| Z-score | Simple and common | Sensitive to mean, spread and outliers |
| Median/MAD | More robust | Needs sufficient data |
| Percent change | Easy to explain | Unstable near zero |
Common mistakes to avoid
- Fitting scalers on the full dataset.
- Discarding raw units.
- Using a scaler from another sensor setup.
Frequently asked questions
Should labels be used to normalize?
Use the intended reference population, typically training healthy data.
Can normalization remove faults?
Poorly chosen adaptive normalization can reduce meaningful trends.
Must every axis be scaled separately?
Usually, because their ranges and variation differ.
Practical workflow for this method
Normalization must be fitted inside the training workflow. Calculate the reference mean and spread from healthy training records only, save those parameters, and apply them unchanged to validation and test groups. Recomputing them on every evaluation batch allows future data to influence the score.
Standard deviations estimated from two files are unstable, which is why the current chart is educational rather than deployable. Production work should use a broader healthy set and inspect its distribution. If it is skewed or contains natural extremes, median and median absolute deviation may provide a steadier reference.
Keep a reverse path to raw values. When a normalized alert is triggered, the review page should show the original RMS, reference center, reference spread and resulting standardized value. Transparent arithmetic makes false alarms easier to diagnose.
About the data used in this guide
The charts use a small teaching sample selected from machines M01, M02 and M03, primarily operations OP01 and OP02. The source records tri-axial acceleration at 2 kHz and labels available examples as good or bad. Label coverage is uneven across machine-operation groups, so missing groups are not treated as healthy evidence. These figures are transparent worked examples, not population estimates or universal fault thresholds.
Dataset: CNC Machining Data, CC BY 4.0. Recommended citation: Tnani, Mohamed-Ali; Feil, Michael; Diepold, Klaus. Smart Data Collection System for Brownfield CNC Milling Machines: A New Benchmark Dataset for Data-Driven Machine Monitoring. Procedia CIRP 107 (2022), 131–136. Research paper.
We explain what the selected data supports and avoid naming a mechanical fault when the dataset only provides a good/bad process label. A machine should be inspected by a qualified person before maintenance or safety decisions are made.


