CNC Condition Monitoring
RMS for CNC Monitoring: Useful and Easy to Misread
Learn how RMS summarizes CNC vibration energy, how to calculate it, and why it must be trended by operation and axis.
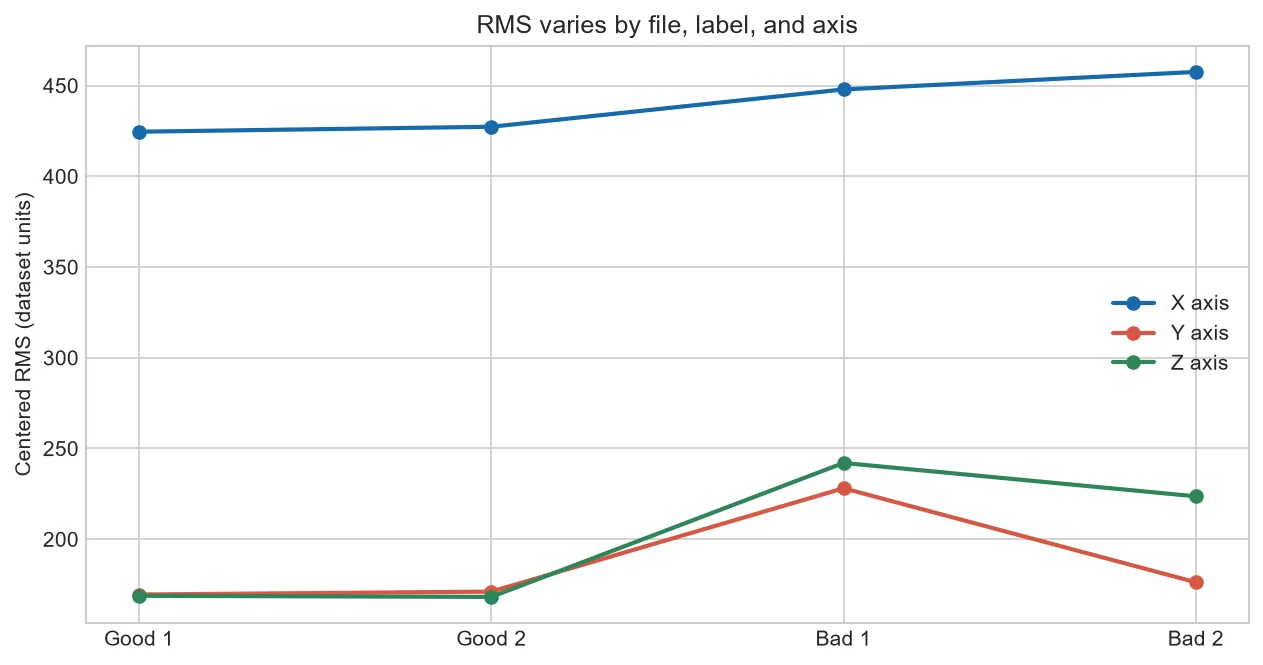
RMS turns thousands of positive and negative vibration samples into one positive number. That makes it excellent for trending. It also throws away timing and frequency information, so it should be treated as a dashboard light—not the whole inspection.
What RMS means
After removing any unwanted mean offset, square every sample, average the squared values, and take the square root. Squaring prevents positive and negative motion from canceling. Larger sustained vibration generally produces a larger RMS value.
Why it works well for trends
One value per cycle is easy to store and chart. A slow rise can prompt inspection before a hard limit is reached. Median and percentile bands from healthy production are often more informative than one copied threshold.
What RMS hides
Two signals can have the same RMS while one is smooth and the other contains repeated impacts. A short fault-related band can also be diluted by a long quiet portion. Window choice and supporting features matter.
Use the sample chart correctly
Our four-file OP01 sample shows a difference between labels, but it does not establish a production limit. The proper next step is to calculate the distribution across many files, dates, and operating conditions, then validate alerts against real inspections.
Calculating and using RMS
Suppose a centered vibration window contains the values −2, −1, 1 and 2. Squaring gives 4, 1, 1 and 4. Their average is 2.5, and the square root is about 1.58. The signs no longer cancel because RMS represents signal energy rather than average direction.
In production, calculate RMS over the same process window each time. Plot the value against part number and add a healthy reference band. If window duration or process state changes, start a new comparison instead of silently joining unlike values.
| Metric | What it preserves | What it loses |
| RMS | Overall signal energy | Timing and frequency location |
| Peak | Largest excursion | Duration and typical level |
| Spectrum band RMS | Energy in a chosen band | Exact event timing |
Common mistakes to avoid
- Calculating RMS across idle and cutting in inconsistent proportions.
- Forgetting to handle an unwanted DC offset.
- Reporting RMS without units or acquisition settings.
- Setting a limit from one healthy cycle.
Frequently asked questions
Should the mean always be removed?
Remove it when it represents sensor bias or gravity projection not relevant to the analysis. Document the preprocessing choice.
Is RMS the same as standard deviation?
For a zero-mean signal they are closely related; definitions and sample normalization should still be stated.
Can RMS detect a single impact?
It may, but a short impact can be diluted in a long window. Peak and crest factor provide useful companions.
About the data used in this guide
The charts use selected files from machine M01, operation OP01. The source records tri-axial acceleration at 2 kHz and labels process examples as good or bad. Our initial charts use two files from each label. They are teaching examples, not universal fault thresholds.
Dataset: CNC Machining Data, CC BY 4.0. Recommended citation: Tnani, Mohamed-Ali; Feil, Michael; Diepold, Klaus. Smart Data Collection System for Brownfield CNC Milling Machines: A New Benchmark Dataset for Data-Driven Machine Monitoring. Procedia CIRP 107 (2022), 131–136. Research paper.
We explain what the selected data supports and avoid naming a mechanical fault when the dataset only provides a good/bad process label. A machine should be inspected by a qualified person before maintenance or safety decisions are made.


