CNC Condition Monitoring
How to Read a CNC Vibration Waveform Without Getting Lost
Learn to inspect time-domain CNC vibration for impacts, bursts, drift, repeating cycles, and changes in operating state.
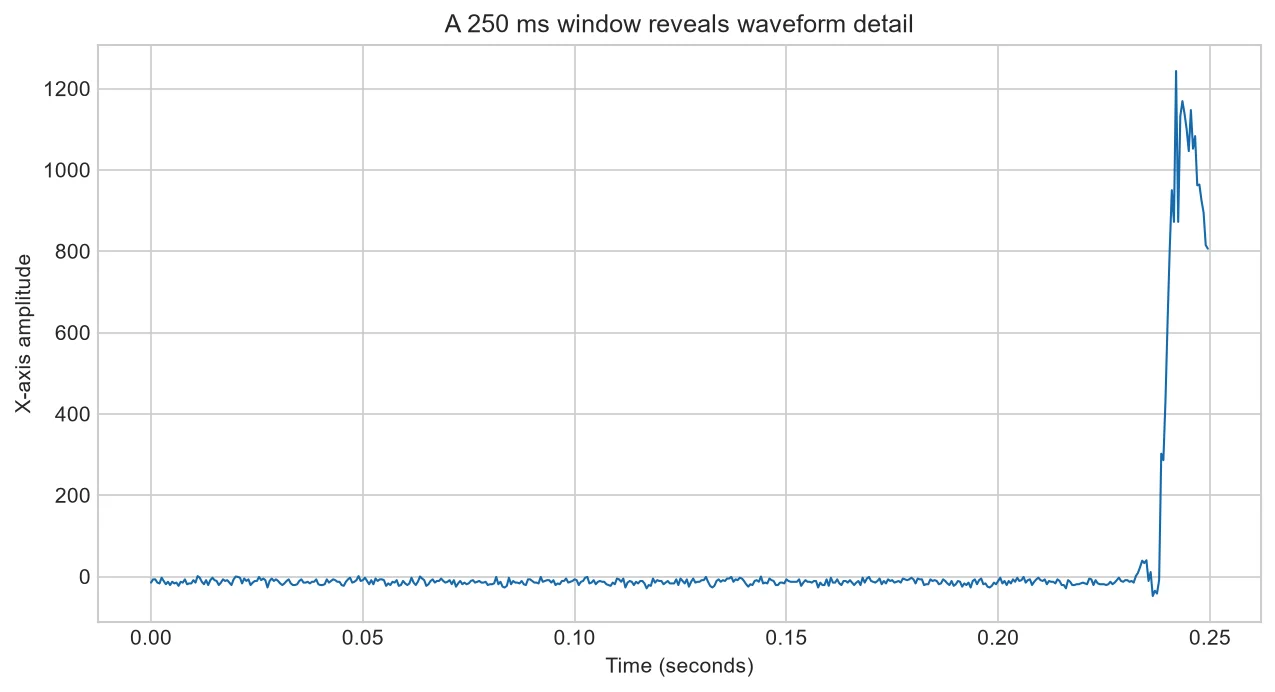
A waveform is simply vibration amplitude plotted against time. It looks busy because machining is busy. Instead of reading every wiggle, look for structure: when the signal grows, when it settles, and whether unusual impacts repeat.
Read at two scales
A one-second view exposes individual bursts and oscillations. A full-cycle view shows entry, steady cutting, tool changes, and exit. Both matter. A brief impact may disappear in a whole-cycle average, while a short view may hide a gradual process shift.
Look for events, not decorations
Useful observations include isolated impacts, periodic bursts, amplitude modulation, clipping, a changing center line, and abrupt state transitions. These are descriptions, not diagnoses. They help decide which supporting data to inspect.
Beware of process boundaries
Tool entry can create a legitimate impact. Rapid motion may look different from cutting. If machine state is available, align it with the vibration trace. Otherwise, compare cycles with consistent timing and note uncertainty.
Make a repeatable review routine
Plot identical time ranges and amplitude scales for comparable cycles. Add RMS and peak beside the plot. When a trace looks unusual, save the raw segment and the production context so another person can reproduce the review.
A repeatable waveform review
Begin with the full machining record and mark obvious states: idle, approach, tool entry, steady cutting, exit and rapid return. Next, inspect the same one-second cutting window across several healthy parts. Use identical axes and plot limits so visual differences are not created by automatic scaling.
If an impact appears, zoom into a short region around it. Check whether it occurs at the same process time on every part. A repeatable tool-entry impact has a different meaning from an impact that begins unexpectedly halfway through a stable cut.
| Waveform pattern | Next check |
| Single isolated spike | Sensor cable, clipping, chip impact and nearby axes |
| Repeating bursts | Tool engagement, tooth timing or programmed motion |
| Gradual amplitude increase | Tool wear, warming, load or changing engagement |
| Abrupt permanent shift | Process state, fixture, tool or sensor movement |
Common mistakes to avoid
- Letting chart software use a different scale for every file.
- Looking only at a one-second crop and missing the process state.
- Removing outliers before checking whether they are real impacts.
- Comparing cycles that start at different events.
Frequently asked questions
How much waveform should I display?
Use at least two views: the complete relevant cycle and a fixed short window for detail.
Should I smooth the signal?
Only with a documented purpose. Smoothing can hide impacts, so keep the raw trace available.
What does a flat-topped waveform mean?
It may indicate clipping or sensor-range saturation. Check acquisition settings before interpreting the machine.
About the data used in this guide
The charts use selected files from machine M01, operation OP01. The source records tri-axial acceleration at 2 kHz and labels process examples as good or bad. Our initial charts use two files from each label. They are teaching examples, not universal fault thresholds.
Dataset: CNC Machining Data, CC BY 4.0. Recommended citation: Tnani, Mohamed-Ali; Feil, Michael; Diepold, Klaus. Smart Data Collection System for Brownfield CNC Milling Machines: A New Benchmark Dataset for Data-Driven Machine Monitoring. Procedia CIRP 107 (2022), 131–136. Research paper.
We explain what the selected data supports and avoid naming a mechanical fault when the dataset only provides a good/bad process label. A machine should be inspected by a qualified person before maintenance or safety decisions are made.


