CNC Condition Monitoring
Peak and Peak-to-Peak Vibration in CNC Data
Understand peak, absolute peak, and peak-to-peak measurements—and why one stray sample can distort them.
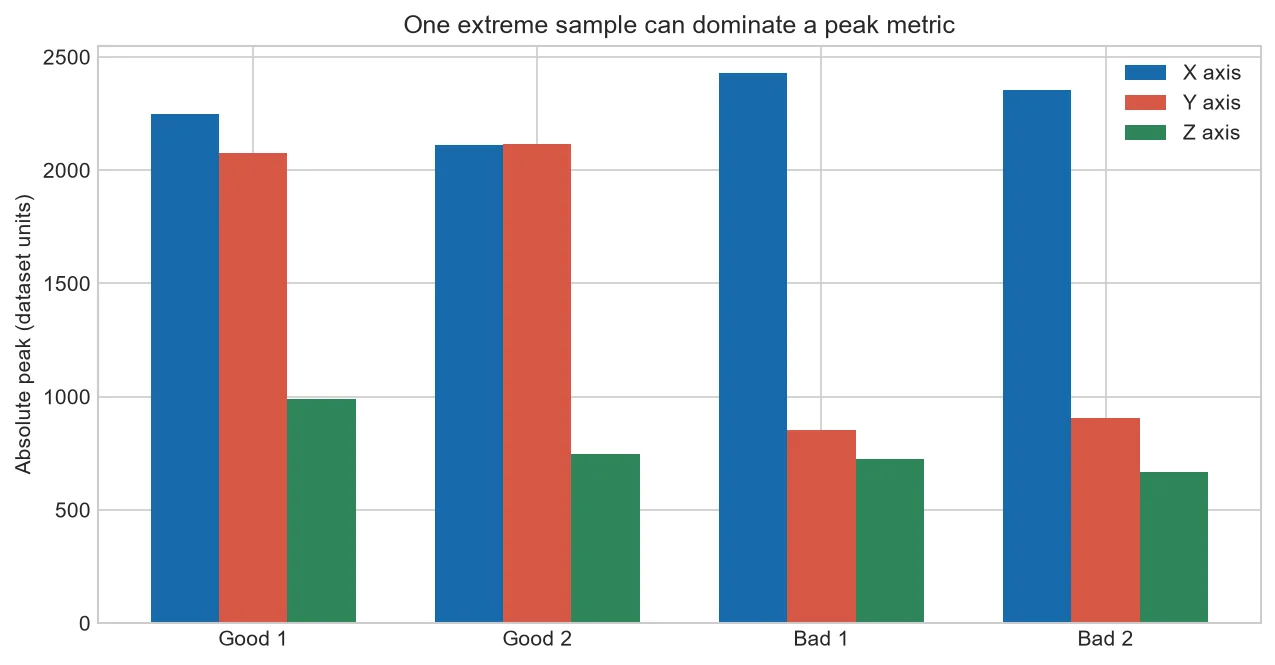
Peak measurements answer a direct question: how far did the signal move at its most extreme point? They are useful for impacts and clearance events, but they are also sensitive to noise and one-off electrical spikes.
Three similar terms
Positive peak is the highest value. Absolute peak is the largest magnitude in either direction. Peak-to-peak is the distance from the lowest to the highest sample. Reports should state which definition is used.
Why peaks jump around
A single chip strike, sensor cable disturbance, controller glitch, or real mechanical impact can set the maximum for an entire cycle. That makes peak a useful event detector and a poor standalone measure of overall severity.
Add a quality check
When a peak changes sharply, plot several milliseconds before and after it. Check for clipping, impossible steps, and simultaneous behavior on other axes. Repeatable physical events look different from isolated bad samples.
Use robust companions
Percentiles, RMS, and band-limited energy are less dominated by one sample. A monitoring dashboard can show both: a stable energy trend and a separate impact indicator.
Why the definition changes the answer
Consider centered samples with a maximum of +8 and a minimum of −12. Positive peak is 8, absolute peak is 12, and peak-to-peak is 20. Writing only “peak = 20” would make the report impossible to interpret correctly.
For the selected M01/OP01 files, X has the largest absolute peaks. That observation is specific to these records and sensor axes. It should be trended with matched data, not compared with an unrelated machine’s peak limit.
| Term | Calculation using +8 and −12 | Result |
| Positive peak | Maximum value | 8 |
| Absolute peak | Maximum absolute value | 12 |
| Peak-to-peak | Maximum minus minimum | 20 |
Common mistakes to avoid
- Using “peak” without defining it.
- Trusting an extreme value before checking for clipping or a corrupt sample.
- Comparing peaks from records with different filtering.
- Assuming a high peak means high vibration throughout the cycle.
Frequently asked questions
Is peak-to-peak always twice the absolute peak?
Only for a symmetric signal with equal positive and negative extremes. Real records are rarely exact.
Should I remove one-sample spikes?
Inspect them first. Remove data only under a documented quality rule, not because it is inconvenient.
How can I make peak more stable?
Use event validation, percentiles or repeated-cycle logic while preserving the true peak as a separate metric.
About the data used in this guide
The charts use selected files from machine M01, operation OP01. The source records tri-axial acceleration at 2 kHz and labels process examples as good or bad. Our initial charts use two files from each label. They are teaching examples, not universal fault thresholds.
Dataset: CNC Machining Data, CC BY 4.0. Recommended citation: Tnani, Mohamed-Ali; Feil, Michael; Diepold, Klaus. Smart Data Collection System for Brownfield CNC Milling Machines: A New Benchmark Dataset for Data-Driven Machine Monitoring. Procedia CIRP 107 (2022), 131–136. Research paper.
We explain what the selected data supports and avoid naming a mechanical fault when the dataset only provides a good/bad process label. A machine should be inspected by a qualified person before maintenance or safety decisions are made.


