CNC Condition Monitoring
Building a CNC Operation Fingerprint from Three-Axis RMS
Use normalized X, Y and Z RMS to describe operation direction while preserving the raw signal for review.
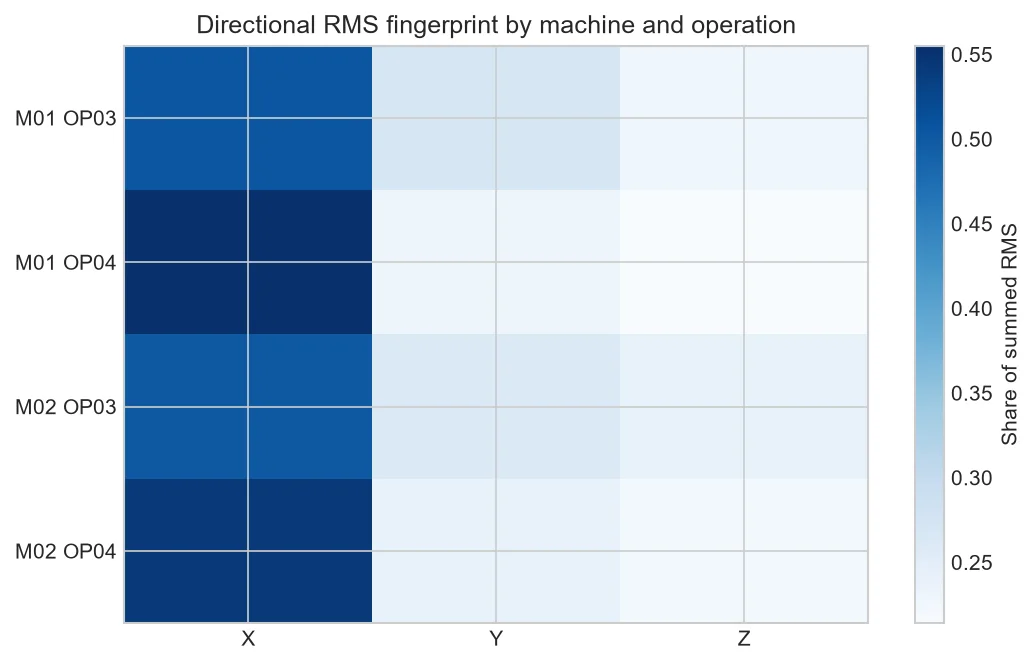
An operation fingerprint is a compact description of how vibration is distributed. The heatmap normalizes each row so direction stands out even when raw scales differ.
How the heatmap is built
Calculate mean healthy RMS for each axis, divide each value by the three-axis sum, and display the resulting proportions.
What a row can reveal
A row dominated by X has a different directional balance from one spread across all axes. That may reflect toolpath, structure or mounting.
What normalization hides
Two records with very different total energy can have identical proportions. Severity must remain a separate feature.
Trend the fingerprint
Measure distance from the healthy directional pattern and review persistent changes alongside raw features.
Use two charts, not one
Place total three-axis RMS above the fingerprint heatmap. If total energy rises but proportions stay stable, the change is broad. If one share moves, investigate directional process or structural changes.
After remounting the sensor, expect the fingerprint to change. Begin a new reference unless orientation can be reproduced.
| Feature | Answers |
| Raw axis RMS | How much measured energy? |
| Axis share | Where is it distributed? |
| Fingerprint distance | How much did balance change? |
Common mistakes to avoid
- Calling high share high severity.
- Comparing rotated sensors.
- Normalizing before checking bad data.
Frequently asked questions
Do shares use physical vector magnitude?
No; this example uses each RMS divided by their sum.
Can fingerprints compare operations?
Yes, as descriptive patterns with matched setup.
Is one fingerprint enough?
No, healthy variation needs a range.
Practical workflow for this method
Build fingerprints from many healthy cycles and show percentile bands for each share.
Combine directional distance with process state so a programmed toolpath change is not mistaken for degradation.
Calculate fingerprint stability across healthy files before setting a distance threshold. A wide natural range needs more context or a different feature.
If total RMS and fingerprint distance rise together, preserve both observations. One describes scale and the other redistribution.
One simple fingerprint-distance calculation is the sum of absolute changes in axis shares. If healthy shares are 0.50, 0.25 and 0.25, and a new cycle is 0.40, 0.35 and 0.25, the total absolute change is 0.20. Because shares sum to one, interpret the score relative to a healthy distribution rather than as an independent physical unit.
For a production display, show the current fingerprint, the healthy median fingerprint, total RMS and recent trend. This prevents a normalized pattern from looking severe when the entire signal is quiet.
About the data used in this guide
The charts use a small teaching sample selected from machines M01, M02 and M03, primarily operations OP03 and OP04. The source records tri-axial acceleration at 2 kHz and labels available examples as good or bad. Label coverage is uneven across machine-operation groups, so missing groups are not treated as healthy evidence. These figures are transparent worked examples, not population estimates or universal fault thresholds.
Dataset: CNC Machining Data, CC BY 4.0. Recommended citation: Tnani, Mohamed-Ali; Feil, Michael; Diepold, Klaus. Smart Data Collection System for Brownfield CNC Milling Machines: A New Benchmark Dataset for Data-Driven Machine Monitoring. Procedia CIRP 107 (2022), 131–136. Research paper.
We explain what the selected data supports and avoid naming a mechanical fault when the dataset only provides a good/bad process label. A machine should be inspected by a qualified person before maintenance or safety decisions are made.


