CNC Condition Monitoring
PCA for CNC Vibration Features Without the Mystery
Learn what a PCA feature map shows, how scaling changes it and why grouped validation still matters for CNC monitoring.
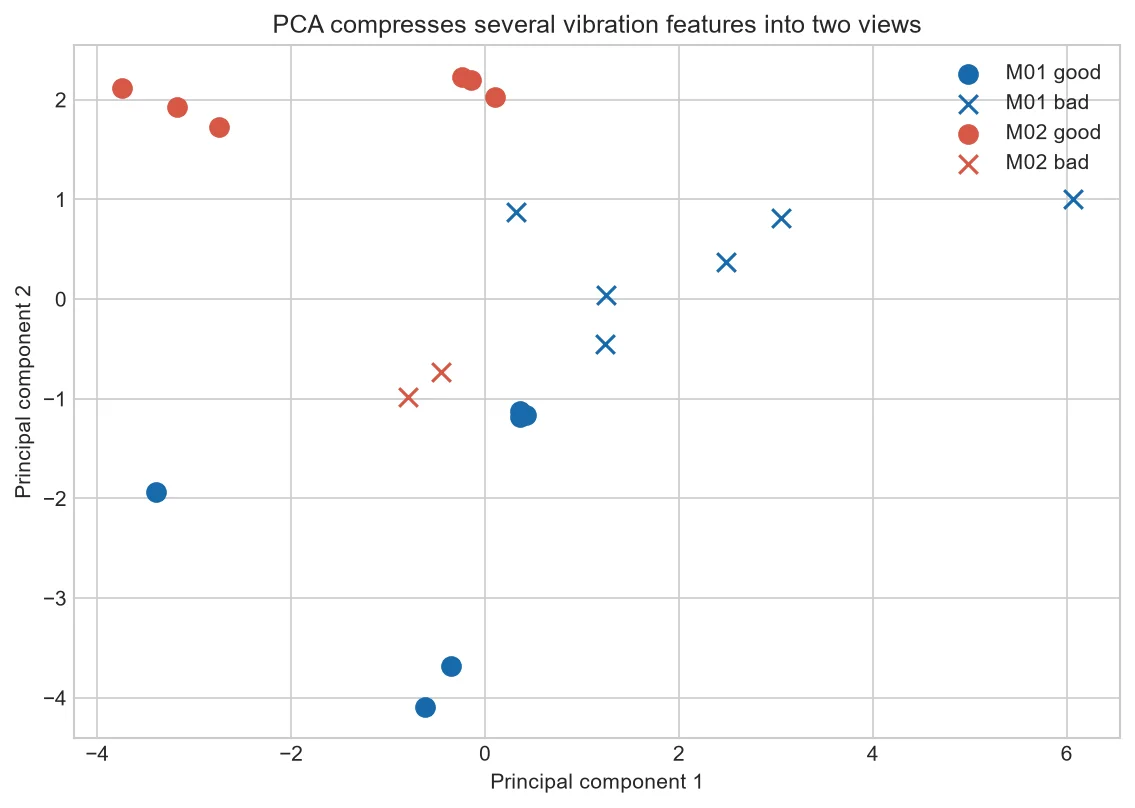
Principal component analysis rotates a feature table into new axes that capture large patterns of variation. It is valuable for exploration, but a visually separated plot does not by itself prove that a deployable classifier exists.
Why scaling matters
RMS, kurtosis and crossing rate use different numerical ranges. Without standardization, the feature with the largest units can dominate the projection regardless of engineering importance.
How to read the map
Nearby points have similar combinations of the included standardized features. Distance is descriptive; it does not explain the mechanical cause or guarantee class separation in new data.
Loadings restore meaning
Each principal component is a weighted mixture. Review those weights to learn whether the visible direction is driven by energy, impulsiveness, spectrum distribution or another feature.
Avoid leakage
If scaling and PCA see the entire dataset before splitting, information from the test groups influences the representation. Fit every learned transform inside the training fold.
Use PCA as an audit view
Color points by operation, shape them by machine and outline labels. If clustering follows machine more than condition, the feature set may encode identity rather than health.
Repeat the plot with one machine held out. A structure that disappears out of group should not support broad deployment claims.
| PCA item | Question |
| Scores | Which records look similar? |
| Loadings | Which features drive directions? |
| Explained variance | How much variation is retained? |
Common mistakes to avoid
- Fitting before splitting.
- Ignoring feature scaling.
- Calling visual clusters proof of accuracy.
Frequently asked questions
Is PCA machine learning?
It is an unsupervised dimensionality-reduction method.
Does PCA use labels?
Ordinary PCA does not.
Must two components be enough?
No; two are convenient for display, not guaranteed to retain every useful pattern.
Practical workflow for this method
Compare PCA with and without machine normalization, then evaluate on untouched groups to see whether apparent condition structure survives.
Version the feature schema. PCA coefficients are meaningful only for the exact input order, preprocessing and fitted reference data.
About the data used in this guide
The charts use a small teaching sample selected from machines M01, M02 and M03, primarily operations OP05 and OP06. The source records tri-axial acceleration at 2 kHz and labels available examples as good or bad. Label coverage is uneven across machine-operation groups, so missing groups are not treated as healthy evidence. These figures are transparent worked examples, not population estimates or universal fault thresholds.
Dataset: CNC Machining Data, CC BY 4.0. Recommended citation: Tnani, Mohamed-Ali; Feil, Michael; Diepold, Klaus. Smart Data Collection System for Brownfield CNC Milling Machines: A New Benchmark Dataset for Data-Driven Machine Monitoring. Procedia CIRP 107 (2022), 131–136. Research paper.
We explain what the selected data supports and avoid naming a mechanical fault when the dataset only provides a good/bad process label. A machine should be inspected by a qualified person before maintenance or safety decisions are made.


