CNC Condition Monitoring
Control Charts for CNC Vibration Baselines
Build an interpretable CNC vibration control chart while respecting autocorrelation, operation phases and non-normal healthy data.
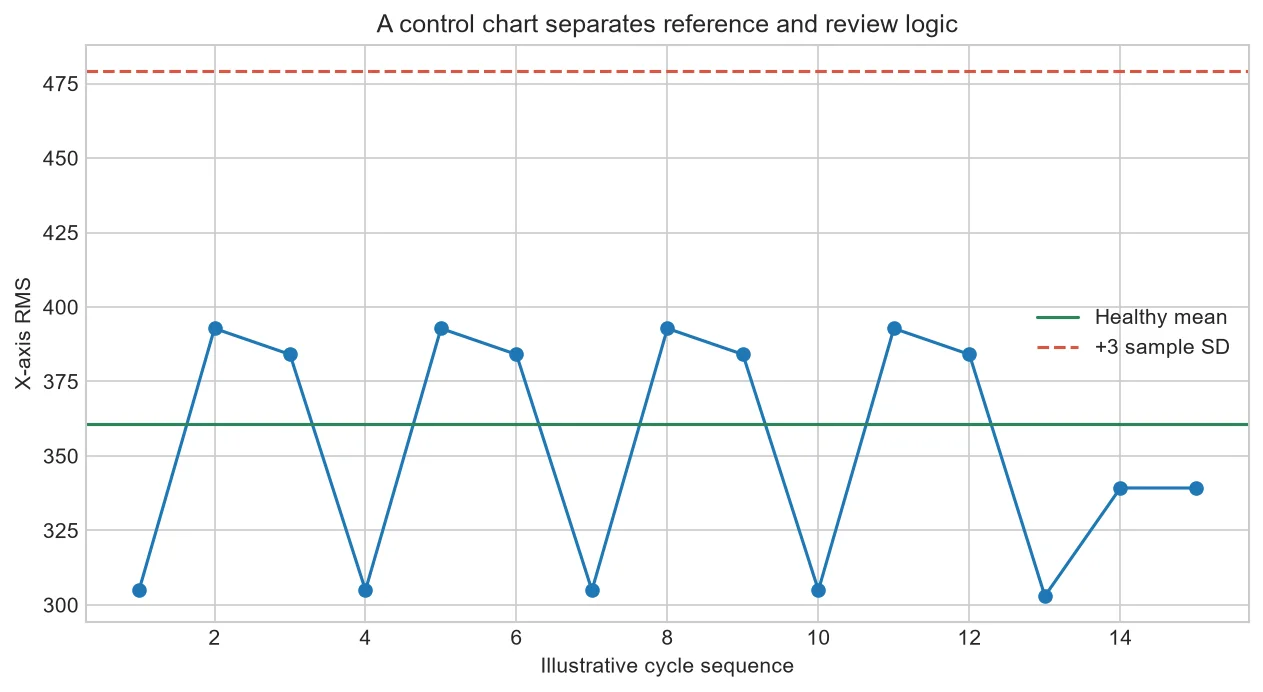
A control chart places sequential feature values against a reference center and limits. Its greatest strength is not a magic three-sigma line but a disciplined view of time, stability and process context.
What the lines mean
The center estimates ordinary operation and the limits describe expected statistical variation under stated assumptions. They are not engineering safety limits and do not prove a fault outside the band.
Check the distribution
Mean plus or minus three standard deviations is familiar but sensitive to outliers and non-normality. Percentile or robust alternatives may fit skewed healthy features better.
Time dependence matters
Overlapping windows and neighboring cycles can be correlated. That changes the frequency of apparent rule violations, so validation must use realistic sequences rather than shuffled points alone.
Version the baseline
A verified tool, program or sensor change may require a new reference. Preserve the previous version and record why the transition occurred.
Commission a chart cautiously
Use an initial healthy period to propose a center and limits, then freeze them and observe a later validation period. Review both single exceedances and longer runs on one side of the center.
Do not automatically absorb alerting points into the baseline. Confirm the operational state first or the chart will learn away the change it should reveal.
| Element | Meaning |
| Center line | Reference tendency |
| Control limits | Expected statistical range |
| Specification limits | Separate product or engineering requirement |
Common mistakes to avoid
- Confusing control and specification limits.
- Shuffling away time structure.
- Updating limits after every alert.
Frequently asked questions
Must limits be three sigma?
No; choose a method that fits the reference distribution and desired false-alert rate.
How many healthy points are enough?
There is no universal count; assess coverage, stability and uncertainty.
Can each operation share a chart?
Usually separate phase or operation baselines are clearer.
Practical workflow for this method
Backtest the complete rule set on chronological healthy data and report alerts per operating hour, not only point-level accuracy.
Annotate maintenance and production changes directly on the chart to preserve the engineering story behind statistical movement.
About the data used in this guide
The charts use a small teaching sample selected from machines M01, M02 and M03, primarily operations OP05 and OP06. The source records tri-axial acceleration at 2 kHz and labels available examples as good or bad. Label coverage is uneven across machine-operation groups, so missing groups are not treated as healthy evidence. These figures are transparent worked examples, not population estimates or universal fault thresholds.
Dataset: CNC Machining Data, CC BY 4.0. Recommended citation: Tnani, Mohamed-Ali; Feil, Michael; Diepold, Klaus. Smart Data Collection System for Brownfield CNC Milling Machines: A New Benchmark Dataset for Data-Driven Machine Monitoring. Procedia CIRP 107 (2022), 131–136. Research paper.
We explain what the selected data supports and avoid naming a mechanical fault when the dataset only provides a good/bad process label. A machine should be inspected by a qualified person before maintenance or safety decisions are made.


