CNC Condition Monitoring
Feature Space for CNC Anomaly Detection: A Visual Introduction
Learn how two vibration features form a condition map and why clusters, overlap and outliers require careful validation.
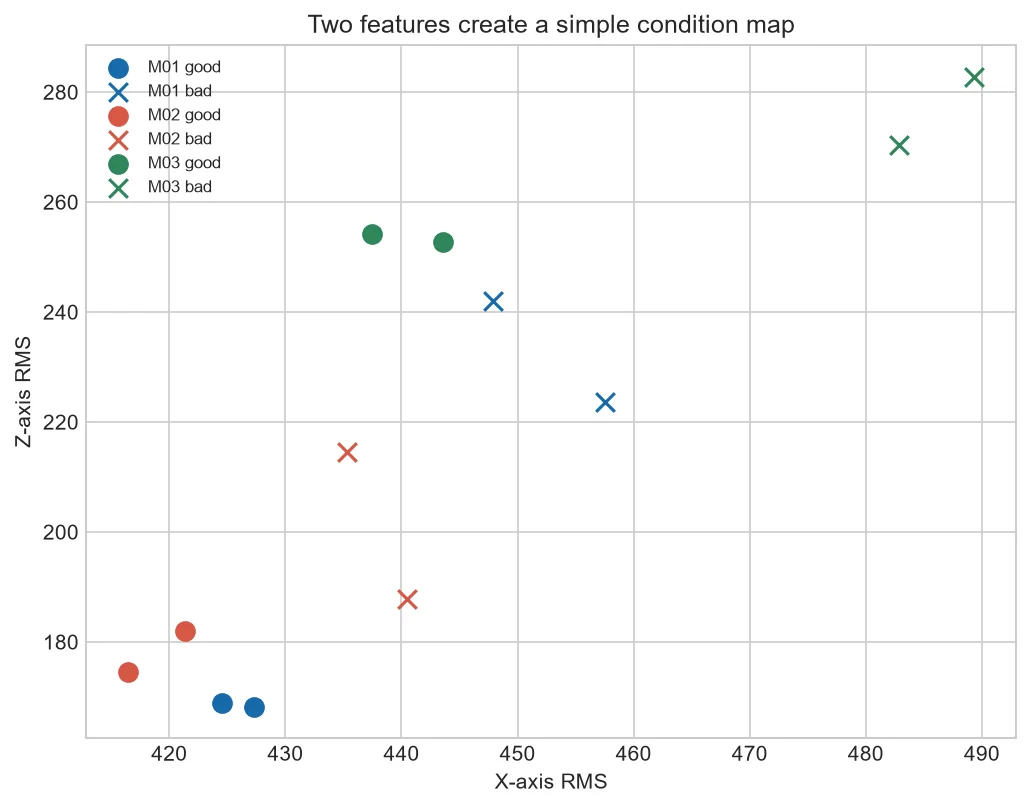
A feature-space plot turns each vibration record into a point. Nearby points have similar chosen features; distant points differ. This simple picture is the foundation of many anomaly-detection methods.
Reading the axes
The horizontal position is X-axis RMS and vertical position is Z-axis RMS. Machine and label are shown by color and marker.
Clusters and overlap
A cluster may represent a stable process, machine identity or acquisition condition. Overlap means the selected features cannot cleanly separate labels.
Add features carefully
More dimensions can capture useful patterns but become harder to inspect and easier to overfit. Begin with explainable features.
Validate outside the picture
Test on unseen dates and machines. A neat plot of training data can disappear when conditions change.
From one number to a condition map
A cycle with X RMS 430 and Z RMS 170 becomes the point (430,170). Plotting many cycles reveals spread and overlap that a single threshold hides.
Add labels only for evaluation. In live monitoring, the new point arrives without a known label; the method must decide whether its distance from healthy data is unusual.
| Plot pattern | Question to ask |
| Tight cluster | Are conditions truly matched? |
| Two machine clusters | Is machine identity dominating? |
| One distant point | Fault, process change or bad data? |
Common mistakes to avoid
- Judging performance from the training plot.
- Selecting features after viewing test labels.
- Ignoring units and scaling.
Frequently asked questions
How many features should I use?
Begin with a small explainable set and add only validated information.
Can a 2D plot represent a larger model?
Only partially, but it is valuable for sanity checks.
What is an outlier?
A point unusual under a defined reference and distance rule.
Practical workflow for this method
Build the plot using only features that can be explained. X-axis RMS and Z-axis RMS are a reasonable teaching pair because both have direct definitions. Each file becomes one point. Add machine and label styling after the coordinates are calculated so the plot does not influence feature construction.
A distance rule needs a healthy reference. Euclidean distance treats every scaled direction equally, while covariance-aware methods account for correlated features. Both can fail if the reference contains several unmatched operations or too few cycles. Plotting the points is a valuable check before choosing a distance.
When a new point is far from the cluster, inspect which feature caused the distance. An operator benefits more from “Z RMS rose beyond its OP01 range” than from an unexplained anomaly score of 0.91.
About the data used in this guide
The charts use a small teaching sample selected from machines M01, M02 and M03, primarily operations OP01 and OP02. The source records tri-axial acceleration at 2 kHz and labels available examples as good or bad. Label coverage is uneven across machine-operation groups, so missing groups are not treated as healthy evidence. These figures are transparent worked examples, not population estimates or universal fault thresholds.
Dataset: CNC Machining Data, CC BY 4.0. Recommended citation: Tnani, Mohamed-Ali; Feil, Michael; Diepold, Klaus. Smart Data Collection System for Brownfield CNC Milling Machines: A New Benchmark Dataset for Data-Driven Machine Monitoring. Procedia CIRP 107 (2022), 131–136. Research paper.
We explain what the selected data supports and avoid naming a mechanical fault when the dataset only provides a good/bad process label. A machine should be inspected by a qualified person before maintenance or safety decisions are made.


