CNC Condition Monitoring
Normal vs Abnormal CNC Vibration: What the Data Really Shows
See how labeled good and bad CNC vibration examples can differ—and why a label is not the same as a fault diagnosis.
A “bad” label sounds definitive. In a monitoring dataset, it usually means the process was annotated as anomalous. It does not automatically mean a bearing failed, a tool broke, or the machine became unsafe.
What we compared
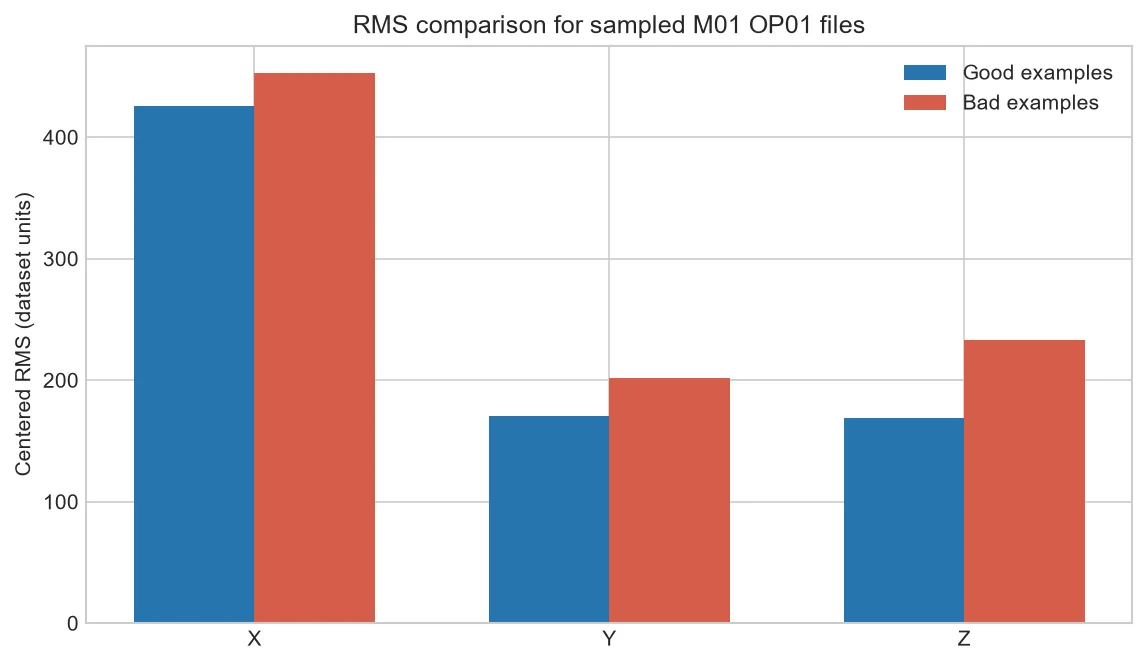
For an initial check, we selected two good and two bad files from machine M01, operation OP01. We removed the mean from each axis and calculated RMS. This is a small exploratory sample, deliberately presented as an example rather than a final model.
What changed in the sample
The bad examples have higher average RMS on all three axes in this small selection, with a clearer difference on Y and Z. Yet crest factor behaves differently: a trace can have higher overall energy while showing a lower ratio between its largest peak and RMS.
Why one threshold is risky
If a limit is taken from four files, it may fail on another date, machine, tool, or operation. A production threshold should be developed from enough healthy cycles to capture normal variation, then checked against known events and maintenance findings.
Turn labels into maintenance evidence
When an alert appears, record tool condition, part quality, fixture state, spindle load, sound, and inspection results. These observations make the next alert easier to interpret and gradually turn anonymous anomalies into useful failure knowledge.
What the four-file comparison tells us
For the two selected good OP01 files, average centered RMS is approximately 426 on X, 170 on Y and 169 on Z. For the two selected bad files, the corresponding averages are about 453, 202 and 233. The separation is visible, especially on Z, but four files are far too few for a production threshold.
The comparison is valuable because it gives us a testable direction: collect more matched OP01 examples and check whether the difference persists across dates. If it disappears, the initial pattern was sample-specific. If it remains and agrees with inspection evidence, it may become a useful feature.
| Axis | Good sample mean RMS | Bad sample mean RMS |
| X | ≈ 426 | ≈ 453 |
| Y | ≈ 170 | ≈ 202 |
| Z | ≈ 169 | ≈ 233 |
Common mistakes to avoid
- Treating a repository label as a named mechanical fault.
- Building a limit from the highest good and lowest bad file in a tiny sample.
- Testing a model on files that are nearly duplicates of its training data.
- Ignoring date, machine and operation when splitting data.
Frequently asked questions
Does “bad” mean unsafe?
Not from this label alone. It denotes anomalous process health in the dataset and does not replace a safety assessment.
Can higher RMS identify the failed component?
No. It shows a change in measured energy; several process and mechanical causes may produce it.
Why keep bad examples?
They help evaluate whether a feature responds to relevant changes and whether an alert method separates known conditions.
About the data used in this guide
The charts use selected files from machine M01, operation OP01. The source records tri-axial acceleration at 2 kHz and labels process examples as good or bad. Our initial charts use two files from each label. They are teaching examples, not universal fault thresholds.
Dataset: CNC Machining Data, CC BY 4.0. Recommended citation: Tnani, Mohamed-Ali; Feil, Michael; Diepold, Klaus. Smart Data Collection System for Brownfield CNC Milling Machines: A New Benchmark Dataset for Data-Driven Machine Monitoring. Procedia CIRP 107 (2022), 131–136. Research paper.
We explain what the selected data supports and avoid naming a mechanical fault when the dataset only provides a good/bad process label. A machine should be inspected by a qualified person before maintenance or safety decisions are made.


