CNC Condition Monitoring
Comparing CNC Vibration: Why “Normal” Is Not Universal
A data-led comparison of healthy OP01 vibration from three CNC machines and the case for machine-specific baselines.
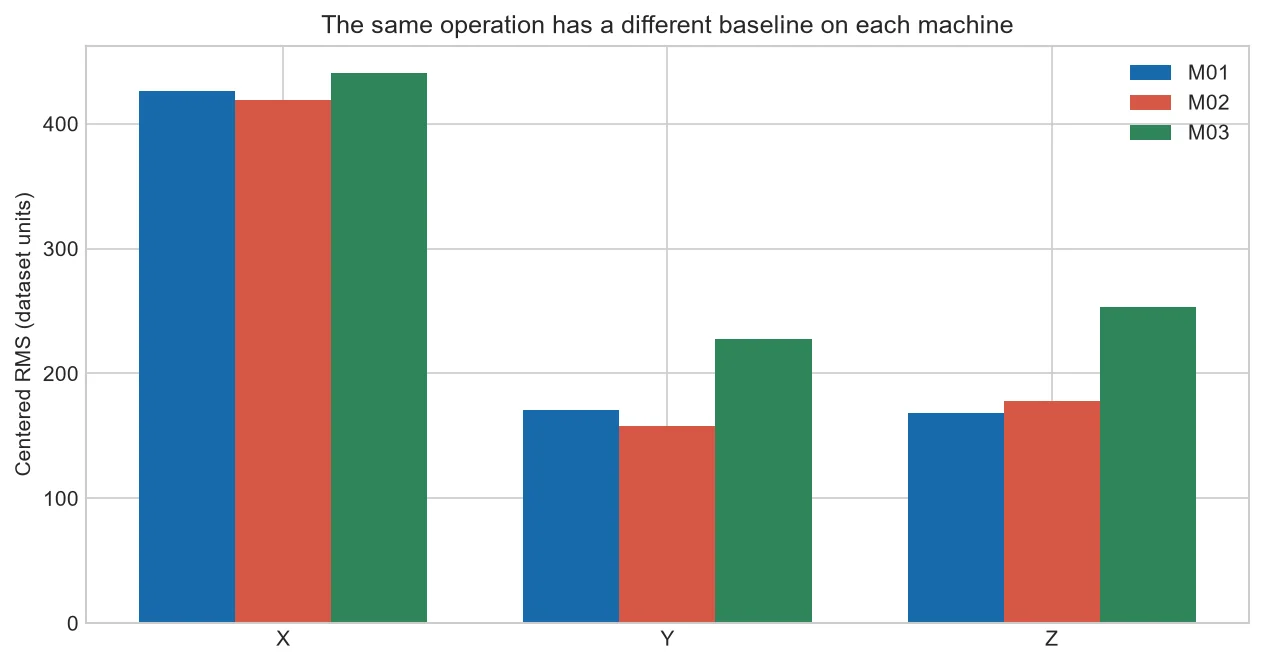
Two CNC machines can run the same numbered operation and still produce different vibration signals. Differences in structure, age, mounting and sensor coupling mean that “normal” belongs to a defined machine and process—not to CNC machines as a whole.
What the chart compares
We calculated centered RMS for two selected good-labeled OP01 files from each machine. The resulting bars differ by machine and axis. This is an exploratory comparison, but it immediately shows why one raw alarm value should not be copied across a fleet.
Why healthy machines differ
Castings, bearings, drives, foundations, enclosures and sensor mounting create different transfer paths. A signal is the combined result of excitation and structure. Even nominally identical machines accumulate different service histories.
Make comparisons fair
Hold operation, feature calculation, sample rate and preprocessing constant. Document sensor location and orientation. If a machine uses another tool or program revision, call that out rather than hiding it inside a fleet average.
What fleet monitoring should do
Use a shared data format and feature definitions, then learn reference bands per machine and operation. Fleet-level views can compare relative change from each local baseline instead of comparing raw amplitudes.
A fair three-machine comparison
For each machine, select the same operation label and apply identical centering and RMS calculations. In our small sample, the healthy OP01 bars do not line up. The difference is information about the measurement systems—not proof that one machine is defective.
Next, express each new cycle as a change from its own machine baseline. This lets maintenance compare relative movement while retaining the raw chart for engineering review.
| Comparison | Good practice |
| Within one machine | Use the same operation and sensor setup |
| Across machines | Compare relative change from local baselines |
| After maintenance | Start a documented baseline review |
Common mistakes to avoid
- Ranking machine health from raw RMS alone.
- Assuming identical model numbers guarantee identical signals.
- Ignoring sensor mount stiffness.
Frequently asked questions
Can one dashboard monitor all machines?
Yes, with common feature definitions and machine-specific references.
Should every machine have the same limits?
Usually not for raw vibration features.
What if only one machine has anomaly data?
Evaluate transfer cautiously and collect healthy calibration data on the others.
Practical workflow for this method
Start the review with one axis at a time. In the healthy OP01 comparison, each machine has its own three-axis shape. That shape is more useful than a simple ranking of total RMS because it shows whether machine identity affects both scale and direction. Next, repeat the calculation over more dates. A pattern seen in only two files may disappear when normal production variation is included.
For a working dashboard, store two values together: the raw feature and its percentage or standardized change from the local healthy reference. The raw value helps an engineer reproduce the analysis. The relative value helps a supervisor compare machines without assuming their normal amplitudes are equal.
Before escalating a cross-machine difference, verify the sensor model, range, mounting torque, location, orientation, acquisition filtering and process timing. A fleet comparison is only as consistent as its measurement chain.
About the data used in this guide
The charts use a small teaching sample selected from machines M01, M02 and M03, primarily operations OP01 and OP02. The source records tri-axial acceleration at 2 kHz and labels available examples as good or bad. Label coverage is uneven across machine-operation groups, so missing groups are not treated as healthy evidence. These figures are transparent worked examples, not population estimates or universal fault thresholds.
Dataset: CNC Machining Data, CC BY 4.0. Recommended citation: Tnani, Mohamed-Ali; Feil, Michael; Diepold, Klaus. Smart Data Collection System for Brownfield CNC Milling Machines: A New Benchmark Dataset for Data-Driven Machine Monitoring. Procedia CIRP 107 (2022), 131–136. Research paper.
We explain what the selected data supports and avoid naming a mechanical fault when the dataset only provides a good/bad process label. A machine should be inspected by a qualified person before maintenance or safety decisions are made.


