CNC Condition Monitoring
Building a Healthy-Baseline Anomaly Score for CNC Machines
Combine standardized vibration features into an interpretable distance from healthy CNC operation without claiming a specific fault.
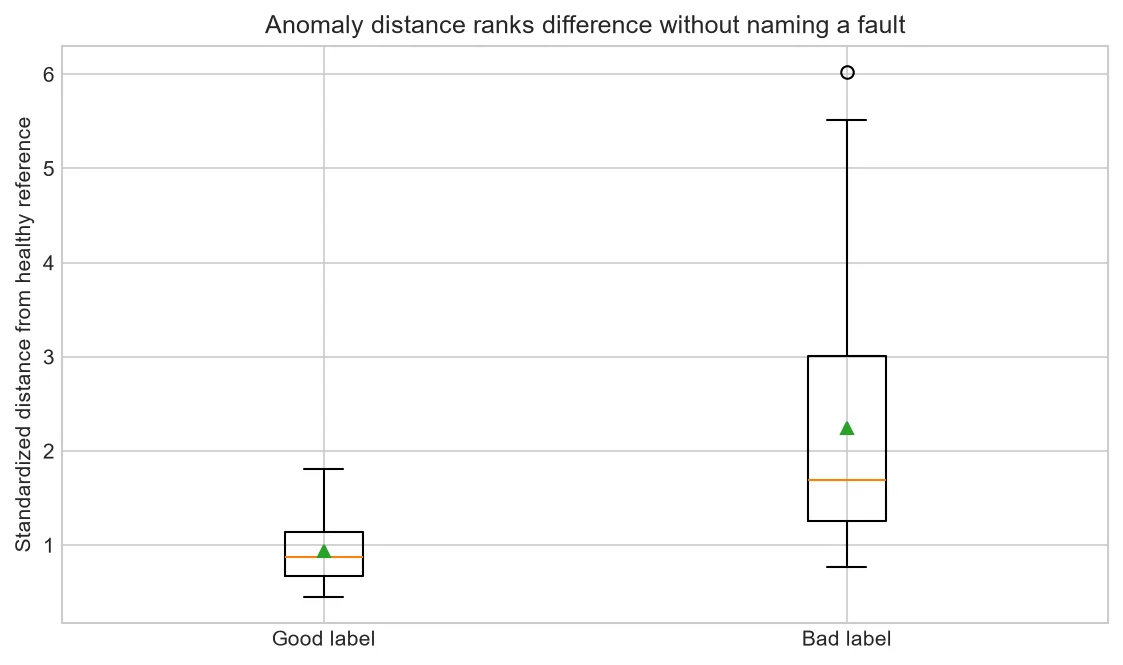
When confirmed fault examples are scarce, a healthy-baseline method can ask whether new behavior differs from known ordinary operation. It detects novelty, not a diagnosis.
Standardize before combining
RMS and crest factor have different scales. Center each feature on the healthy training reference and divide by a stable measure of healthy variation before calculating distance.
Distance needs context
A large score may reflect a new tool, program, speed, sensor mount or actual degradation. Context filters and operator records are part of the method.
Overlap is normal
Good and bad labels may overlap because features are incomplete, labels are broad or conditions share similar signals. Do not promise perfect separation from a teaching chart.
Explain each alert
Show the largest standardized feature changes so an engineer can see whether energy, impulsiveness or an axis-specific pattern drove the score.
Commission a reference model
Collect verified healthy cycles across expected tools and loads, reserve later cycles for validation, and calculate robust centers and scales from training only.
Set a review threshold from validated false-alert workload. Keep a separate rule for unseen or rejected operating contexts.
| Stage | Output |
| Context filter | Comparable cycles |
| Standardization | Feature deviations |
| Combination | Anomaly distance |
| Review | Likely contributing features |
Common mistakes to avoid
- Calling anomaly a fault.
- Using test records in the baseline.
- Letting near-zero feature variance explode scores.
Frequently asked questions
Does it need bad examples?
Not for fitting, but abnormal evidence is valuable for evaluating usefulness.
Can distance be compared across machines?
Only after validating machine-specific normalization.
What if a new operation appears?
Mark it out of scope until an appropriate reference exists.
Practical workflow for this method
Compare diagonal standardized distance with covariance-aware alternatives only when the healthy sample supports stable covariance estimation.
Version the baseline with machine configuration, sensor metadata and acquisition code so scores remain traceable.
About the data used in this guide
The charts use a small teaching sample selected from machines M01, M02 and M03, across the available OP01–OP06 files. The source records tri-axial acceleration at 2 kHz and labels available examples as good or bad. Label coverage is uneven across machine-operation groups, so missing groups are not treated as healthy evidence. These figures are transparent worked examples, not population estimates or universal fault thresholds.
Dataset: CNC Machining Data, CC BY 4.0. Recommended citation: Tnani, Mohamed-Ali; Feil, Michael; Diepold, Klaus. Smart Data Collection System for Brownfield CNC Milling Machines: A New Benchmark Dataset for Data-Driven Machine Monitoring. Procedia CIRP 107 (2022), 131–136. Research paper.
We explain what the selected data supports and avoid naming a mechanical fault when the dataset only provides a good/bad process label. A machine should be inspected by a qualified person before maintenance or safety decisions are made.


