CNC Condition Monitoring
How to Build a CNC Vibration Baseline That Operators Can Trust
A step-by-step plan for collecting healthy CNC vibration data, separating operations, setting practical limits, and reviewing alerts.
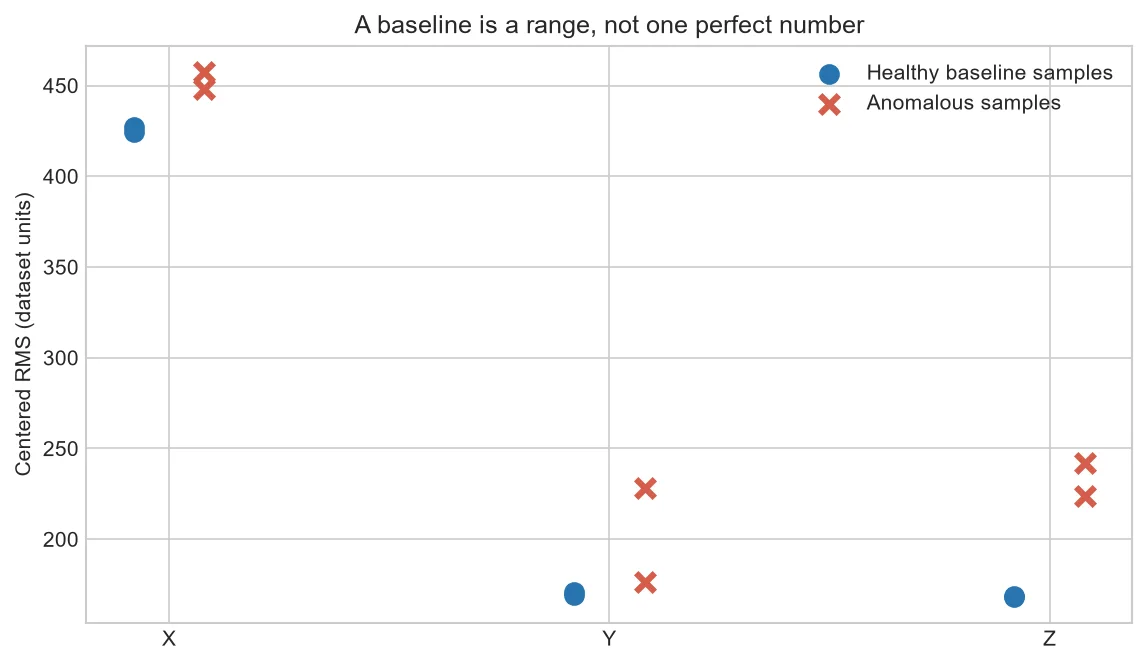
A baseline is a description of normal behavior under defined conditions. It is not one perfect trace. Good production contains variation, and a trustworthy baseline measures that variation instead of hiding it.
Define the monitoring unit
Decide whether one record represents a full part cycle, one operation, or a fixed time window. Separate operations with different cutting conditions. Mixing them creates wide limits that can hide meaningful changes.
Collect healthy evidence
Record multiple days, operators, tools, and normal environmental conditions where relevant. Confirm health with part quality and inspection rather than assuming every early file is good. Store sensor position, orientation, sample rate, program, and tool context.
Choose features people can explain
Begin with per-axis RMS, peak, crest factor, and a few justified frequency bands. Plot the distribution and trend. Use warning bands based on healthy variation, then test them against historical or deliberately reviewed events.
Create an alert workflow
An alert should say what changed, show the comparison, and suggest the next check. It should also allow an operator to record findings. Without feedback, the model cannot distinguish useful alerts from nuisance alarms.
A baseline plan for one CNC operation
Start with one program and one operation, such as OP01. Collect at least several verified healthy cycles over more than one production period. Record tool identity, tool life, material, fixture, spindle speed, feed, sensor position and machine warm-up state.
Calculate per-axis RMS, peak and crest factor over the same cutting window. Plot individual points rather than only an average. A baseline should show expected spread. Review any point outside that spread before deciding whether it represents a machine event or normal production variation.
| Baseline element | Minimum record |
| Measurement setup | Sensor, mount, orientation, range, sample rate and filtering |
| Process setup | Machine, program, operation, tool, material, feed and speed |
| Verification | Part quality, operator note and maintenance state |
| Change control | Date and reason whenever setup or logic changes |
Common mistakes to avoid
- Calling the first collected cycle the baseline.
- Mixing different operations to get more data quickly.
- Deleting unusual healthy cycles without investigating them.
- Leaving thresholds unchanged after major maintenance or sensor remounting.
Frequently asked questions
Should a baseline use mean and standard deviation?
They can help when the distribution is appropriate, but median and percentile ranges may be more robust. Plot the data before choosing.
When should the baseline be updated?
Review it after verified maintenance, process changes, sensor changes or sustained evidence that normal behavior shifted. Keep the old version for traceability.
How should alerts be tested?
Replay historical records where possible, then run a monitored trial and compare alerts with operator and inspection findings.
About the data used in this guide
The charts use selected files from machine M01, operation OP01. The source records tri-axial acceleration at 2 kHz and labels process examples as good or bad. Our initial charts use two files from each label. They are teaching examples, not universal fault thresholds.
Dataset: CNC Machining Data, CC BY 4.0. Recommended citation: Tnani, Mohamed-Ali; Feil, Michael; Diepold, Klaus. Smart Data Collection System for Brownfield CNC Milling Machines: A New Benchmark Dataset for Data-Driven Machine Monitoring. Procedia CIRP 107 (2022), 131–136. Research paper.
We explain what the selected data supports and avoid naming a mechanical fault when the dataset only provides a good/bad process label. A machine should be inspected by a qualified person before maintenance or safety decisions are made.


