CNC Condition Monitoring
Why a CNC Anomaly Score Is Not Automatically a Probability
Learn the difference between ranking, anomaly scores and calibrated probabilities before presenting CNC monitoring risk to operators.
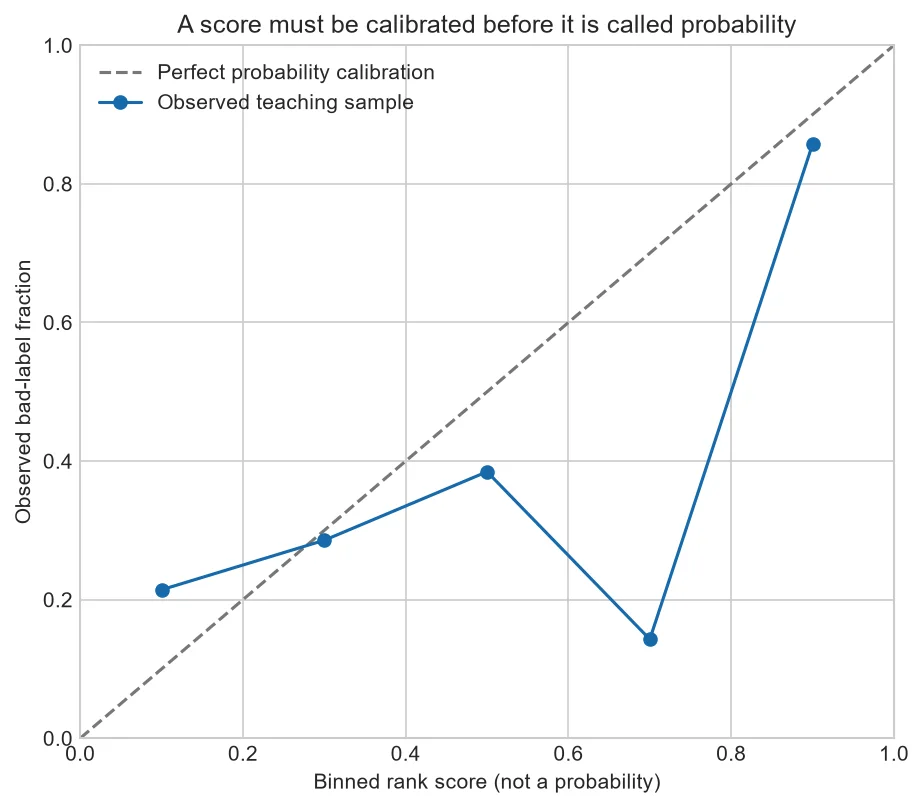
A model output of 0.8 may mean distance, confidence, a transformed feature or probability. Unless calibration has been measured, displaying it as an 80 percent chance is misleading.
Ranking and probability differ
A score can order examples well while its numeric values bear no relationship to event frequency. Ranking quality and probability calibration are separate properties.
How calibration is checked
Group predictions into ranges and compare average predicted probability with observed label frequency. Reliable estimates require enough independent examples in each range.
Prevalence changes meaning
A probability calibrated in a test set with artificial class balance may not transfer to a plant where events are much rarer.
Use plain operator language
If calibration is weak, display low, medium and high review priority with documented boundaries rather than invented percentages.
Publish a score card
State: higher values mean greater distance from the healthy reference; the score is not a failure probability. Show which features contributed and what action each band requests.
If probability is required, fit a calibration mapping on a validation set and verify it on a later untouched period.
| Output | Safe description |
| Distance | Difference from reference |
| Rank | Relative priority |
| Calibrated probability | Estimated frequency under validated conditions |
Common mistakes to avoid
- Adding a percent sign to an arbitrary score.
- Calibrating on training predictions.
- Ignoring changing event prevalence.
Frequently asked questions
Can a good classifier be poorly calibrated?
Yes; it may rank correctly while probabilities are too high or low.
Does calibration diagnose faults?
No, it only improves probability interpretation for defined labels.
How often should it be checked?
Whenever context or prevalence may have changed, and on a scheduled basis.
Practical workflow for this method
Use reliability diagrams with uncertainty and counts per bin; an empty or tiny bin cannot support a precise claim.
Separate model confidence from data-quality confidence so a missing channel does not produce a confidently misleading score.
About the data used in this guide
The charts use a small teaching sample selected from machines M01, M02 and M03, across the available OP01–OP06 files. The source records tri-axial acceleration at 2 kHz and labels available examples as good or bad. Label coverage is uneven across machine-operation groups, so missing groups are not treated as healthy evidence. These figures are transparent worked examples, not population estimates or universal fault thresholds.
Dataset: CNC Machining Data, CC BY 4.0. Recommended citation: Tnani, Mohamed-Ali; Feil, Michael; Diepold, Klaus. Smart Data Collection System for Brownfield CNC Milling Machines: A New Benchmark Dataset for Data-Driven Machine Monitoring. Procedia CIRP 107 (2022), 131–136. Research paper.
We explain what the selected data supports and avoid naming a mechanical fault when the dataset only provides a good/bad process label. A machine should be inspected by a qualified person before maintenance or safety decisions are made.