CNC Condition Monitoring
Choosing a CNC Vibration Threshold by Cost, Not Guesswork
Balance false alerts, missed events and detection delay when selecting a practical CNC vibration threshold.
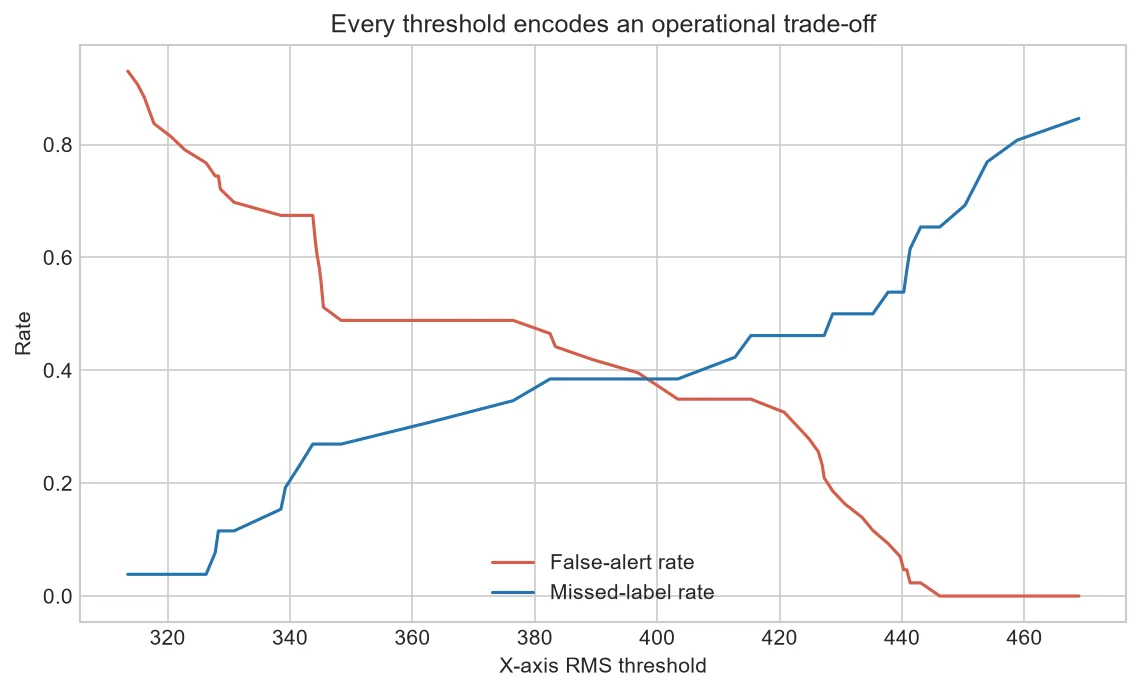
A threshold is an operating decision, not a property hidden inside the data. Raising it usually reduces false alerts while increasing missed events; lowering it does the opposite.
Start from consequences
A warning that triggers a remote review can be more sensitive than a shutdown signal. Separate information, inspection and protective actions instead of forcing one threshold to do everything.
Estimate expected cost
Multiply each error type by its frequency and practical consequence. Approximate values are still more transparent than choosing a line because it looks reasonable.
Add persistence
Threshold and persistence work together. A lower boundary with multi-cycle confirmation may outperform a high single-point trigger, but it can delay detection.
Keep engineering limits separate
A statistical threshold describes unusual data. A manufacturer or safety limit has a different authority and should not be replaced by a learned boundary.
Build a two-level policy
Use a lower warning boundary for three-of-five-cycle review and a higher boundary for rapid escalation. Document reset rules and operation inhibits.
Replay a realistic timeline to count alerts per operating hour and measure delay from the first labeled event.
| Decision | Evidence needed |
| Information only | Stable feature trend |
| Inspection request | Persistent abnormal evidence |
| Stop or protection | Approved engineering/safety logic |
Common mistakes to avoid
- Optimizing on the final test set.
- Ignoring alert frequency.
- Calling a statistical limit a safety limit.
Frequently asked questions
Can a threshold adapt automatically?
Yes, but adaptation needs guardrails, audit history and protection against learning faults as normal.
Should every machine share one value?
Usually not without validated normalization.
What if costs are unknown?
Compare several explicit scenarios and collect workflow evidence.
Practical workflow for this method
Plot the operating trade-off separately for each important context. One global intersection can hide unacceptable subgroup behavior.
Monitor post-deployment alert rate and feature distribution without silently changing the frozen threshold.
About the data used in this guide
The charts use a small teaching sample selected from machines M01, M02 and M03, across the available OP01–OP06 files. The source records tri-axial acceleration at 2 kHz and labels available examples as good or bad. Label coverage is uneven across machine-operation groups, so missing groups are not treated as healthy evidence. These figures are transparent worked examples, not population estimates or universal fault thresholds.
Dataset: CNC Machining Data, CC BY 4.0. Recommended citation: Tnani, Mohamed-Ali; Feil, Michael; Diepold, Klaus. Smart Data Collection System for Brownfield CNC Milling Machines: A New Benchmark Dataset for Data-Driven Machine Monitoring. Procedia CIRP 107 (2022), 131–136. Research paper.
We explain what the selected data supports and avoid naming a mechanical fault when the dataset only provides a good/bad process label. A machine should be inspected by a qualified person before maintenance or safety decisions are made.


