CNC Condition Monitoring
Percentile Thresholds for CNC Vibration: Useful but Not Automatic
Learn how percentile limits work, how much healthy data they need, and why the chosen percentile is a risk decision.
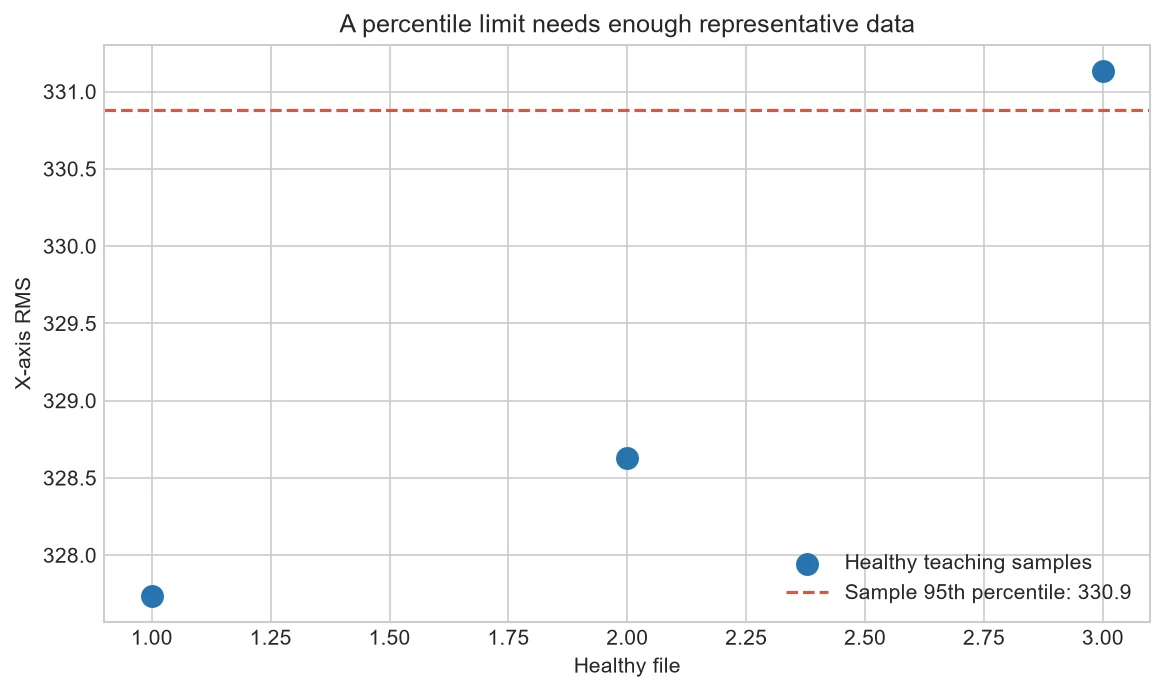
A percentile threshold says what proportion of reference values falls below a level. It is easy to explain, but unreliable when estimated from only a few samples.
What 95th percentile means
About 95 percent of the reference values are at or below it. It does not promise a five-percent false-alarm rate in future shifted data.
Sample size matters
With three values, a percentile is mostly interpolation between observations. The chart is intentionally a warning example.
Condition the reference
Build percentiles per machine and operation, and consider tool life or recipe groups where justified.
Add persistence
Several consecutive exceedances can reduce isolated alarms, but may delay detection.
Build and test a percentile rule
Reserve later healthy cycles and known events as validation. Fit the percentile only on the training reference, then count false alerts and detected events.
Compare 95th, 99th and persistence rules using operational costs. Choose transparently rather than selecting the best test score repeatedly.
| Choice | Trade-off |
| Lower percentile | Earlier, more alerts |
| Higher percentile | Fewer alerts, may miss change |
| Persistence | Fewer spikes, added delay |
Common mistakes to avoid
- Estimating from tiny samples.
- Using test data to choose the final percentile.
- Assuming future false alarms equal reference tail size.
Frequently asked questions
Is 95 percent standard?
No. It is a design choice.
Can percentiles adapt?
Yes, with guarded verified-healthy updates.
Are robust statistics enough?
They help with extremes but do not fix unmatched data.
Practical workflow for this method
Report confidence or uncertainty when sample size is limited.
Monitor the future exceedance rate; a sustained change may signal drift or a broken reference.
Bootstrap intervals can illustrate percentile uncertainty, but resampling cannot invent missing operating conditions. Representative collection remains essential.
Track exceedance frequency after deployment and investigate drift or sensor changes before automatically raising a threshold.
With hundreds of representative healthy cycles, sort feature values and estimate the chosen percentile using a documented method. Reserve later healthy data to measure the actual exceedance rate. A 99th-percentile training limit may exceed more or less than one percent in future production if the process drifts.
Combine warning level, persistence and reset logic. For example, a warning may require three of five cycles above a percentile, while clearing may require five consecutive cycles inside the band. The numbers must be validated against acceptable delay and workload.
About the data used in this guide
The charts use a small teaching sample selected from machines M01, M02 and M03, primarily operations OP03 and OP04. The source records tri-axial acceleration at 2 kHz and labels available examples as good or bad. Label coverage is uneven across machine-operation groups, so missing groups are not treated as healthy evidence. These figures are transparent worked examples, not population estimates or universal fault thresholds.
Dataset: CNC Machining Data, CC BY 4.0. Recommended citation: Tnani, Mohamed-Ali; Feil, Michael; Diepold, Klaus. Smart Data Collection System for Brownfield CNC Milling Machines: A New Benchmark Dataset for Data-Driven Machine Monitoring. Procedia CIRP 107 (2022), 131–136. Research paper.
We explain what the selected data supports and avoid naming a mechanical fault when the dataset only provides a good/bad process label. A machine should be inspected by a qualified person before maintenance or safety decisions are made.


