CNC Condition Monitoring
Axis Correlation in CNC Vibration Data
Understand correlation between X, Y and Z vibration, what it can reveal, and why correlation is not causation.
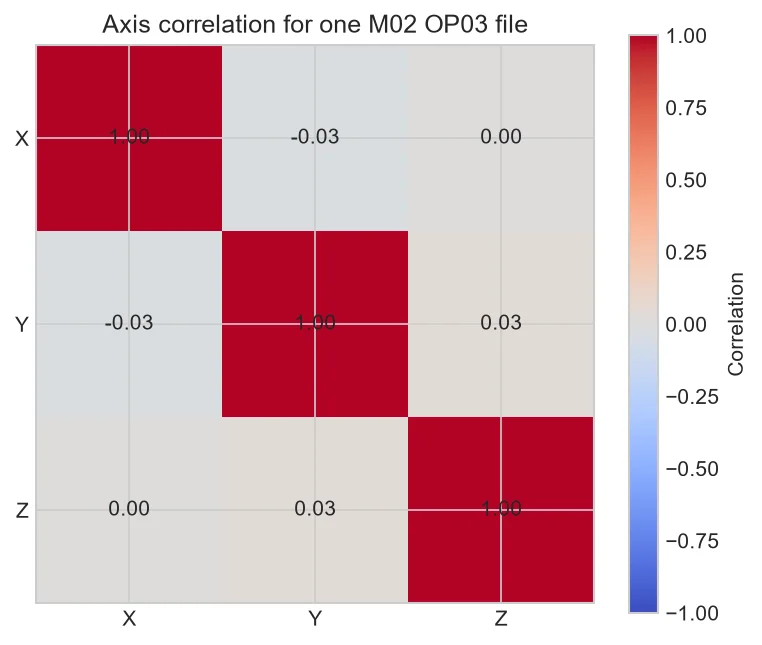
Correlation measures whether two axes rise and fall together. It can describe coupling in one process window, but it does not tell us which direction caused the other.
Reading the matrix
Diagonal values are one because each axis is perfectly correlated with itself. Off-diagonal values range from −1 to +1.
Physical interpretation
Shared cutting forces, structural coupling and mounting can create correlation. Phase and frequency-specific relationships may be hidden by one time-domain number.
Trend relationships
A persistent change in correlation can complement amplitude features when the process is stable.
Know the limit
Nonlinear relationships and delayed responses may have low simple correlation.
A careful correlation workflow
Choose a stable cutting window, remove offsets and calculate the matrix. Repeat across healthy cycles to learn normal spread.
When correlation changes, inspect cross-correlation or coherence by frequency before proposing a mechanical explanation.
| Value | Plain-language meaning |
| Near +1 | Moves together linearly |
| Near 0 | Little linear relationship |
| Near −1 | Moves in opposite directions |
Common mistakes to avoid
- Claiming causation.
- Combining different process states.
- Using one matrix as a limit.
Frequently asked questions
Does zero mean unrelated?
Only no strong linear zero-lag relationship.
Can correlation change with speed?
Yes, process and structural response change.
What is coherence?
A frequency-dependent measure of linear relationship.
Practical workflow for this method
Plot correlation alongside RMS so relationship changes are not confused with simple amplitude loss.
Document filtering because it can substantially change correlation.
Correlation is sensitive to process timing. Use identical event windows so entry impacts do not create artificial differences.
If zero-lag correlation is insufficient, cross-correlation can reveal delay and coherence can describe frequency-specific coupling.
Pearson correlation divides covariance by the product of the two standard deviations. The result has no unit and ranges from minus one to plus one. If one channel is nearly flat, its tiny standard deviation makes the calculation unstable and should trigger a data-quality review.
Build a healthy distribution for each off-diagonal pair: X–Y, X–Z and Y–Z. Trend these values with operation and speed. A persistent shift may justify deeper coherence or structural analysis, while a one-cycle jump should first be checked for alignment and sensor problems.
About the data used in this guide
The charts use a small teaching sample selected from machines M01, M02 and M03, primarily operations OP03 and OP04. The source records tri-axial acceleration at 2 kHz and labels available examples as good or bad. Label coverage is uneven across machine-operation groups, so missing groups are not treated as healthy evidence. These figures are transparent worked examples, not population estimates or universal fault thresholds.
Dataset: CNC Machining Data, CC BY 4.0. Recommended citation: Tnani, Mohamed-Ali; Feil, Michael; Diepold, Klaus. Smart Data Collection System for Brownfield CNC Milling Machines: A New Benchmark Dataset for Data-Driven Machine Monitoring. Procedia CIRP 107 (2022), 131–136. Research paper.
We explain what the selected data supports and avoid naming a mechanical fault when the dataset only provides a good/bad process label. A machine should be inspected by a qualified person before maintenance or safety decisions are made.


