CNC Condition Monitoring
How Sensor Clipping Hides CNC Vibration Severity
Recognize clipped accelerometer signals, understand their effect on RMS and spectra, and prevent invalid CNC condition alerts.
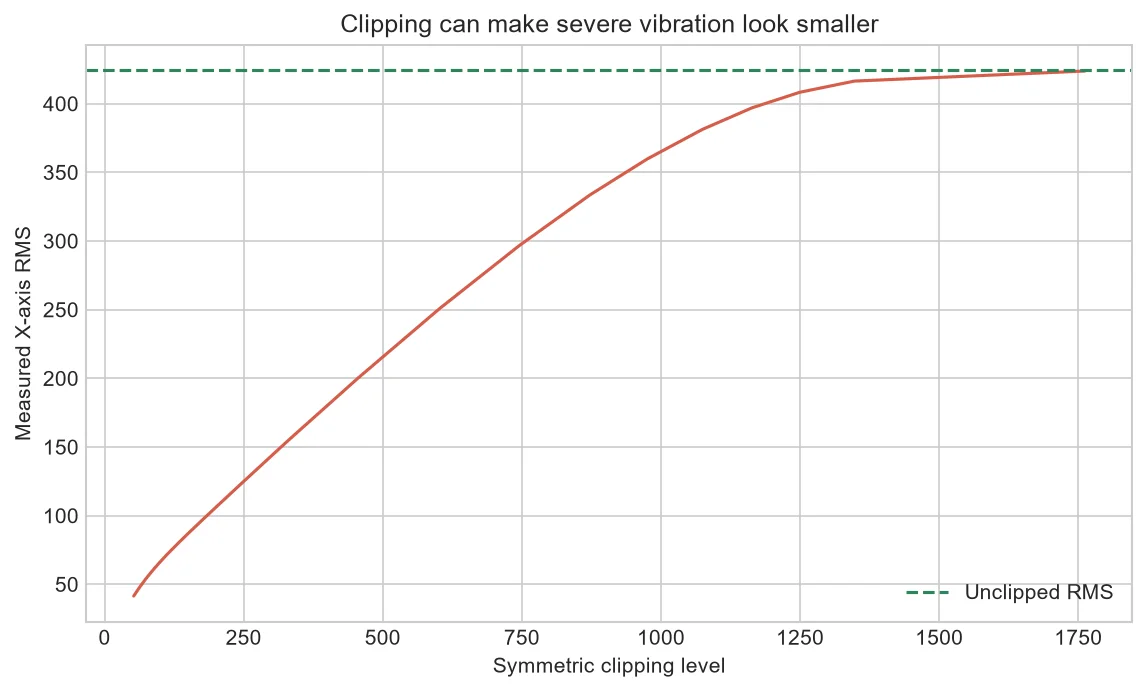
Clipping occurs when the measurement chain reaches its range and flattens larger values. The resulting waveform can look energetic while underreporting the true peaks and distorting many derived features.
What clipping looks like
Repeated samples at the same upper or lower limit create flat waveform tops and spikes in the value histogram. Symmetric clipping may affect both polarities; offset can make it one-sided.
Why features become unreliable
Peak is capped directly, RMS is biased downward and new spectral components appear at sharp flattened edges. Crest factor and kurtosis may move in unintuitive directions.
Detect it automatically
Count samples near known converter limits, inspect repeated extreme values and compare peak occupancy across axes. Use engineering tolerances because digitization can vary by a count.
Prevent recurrence
Select sensor range and gain for expected transients, verify mounting, and include an acquisition-range test during commissioning.
Route quality before condition
If clipping exceeds the validated tolerance, suppress the machine-condition score and issue a sensor-range review. Do not label the cycle normal because RMS stayed below its condition limit.
After changing range, establish measurement comparability and version the baseline; noise floor and scale may also change.
| Feature | Clipping effect |
| Peak | Capped |
| RMS | Usually underestimated |
| Spectrum | Artificial harmonics |
| Kurtosis | Unreliable tail shape |
Common mistakes to avoid
- Filtering a clipped waveform and calling it repaired.
- Treating maximum-range values as real plateaus.
- Continuing with an old baseline after gain changes.
Frequently asked questions
Can clipped data be recovered?
The lost amplitude is generally unknowable; reacquisition is preferable.
Does clipping always raise RMS?
No, limiting extremes usually lowers measured RMS relative to the true signal.
Can one axis clip alone?
Yes, depending on direction, range and coupling.
Practical workflow for this method
Add synthetic clipping tests to acquisition validation so every feature documents its failure behavior.
Store raw converter units and calibrated engineering units where practical to distinguish range saturation from conversion mistakes.
About the data used in this guide
The charts use a small teaching sample selected from machines M01, M02 and M03, across the available OP01–OP06 files. The source records tri-axial acceleration at 2 kHz and labels available examples as good or bad. Label coverage is uneven across machine-operation groups, so missing groups are not treated as healthy evidence. These figures are transparent worked examples, not population estimates or universal fault thresholds.
Dataset: CNC Machining Data, CC BY 4.0. Recommended citation: Tnani, Mohamed-Ali; Feil, Michael; Diepold, Klaus. Smart Data Collection System for Brownfield CNC Milling Machines: A New Benchmark Dataset for Data-Driven Machine Monitoring. Procedia CIRP 107 (2022), 131–136. Research paper.
We explain what the selected data supports and avoid naming a mechanical fault when the dataset only provides a good/bad process label. A machine should be inspected by a qualified person before maintenance or safety decisions are made.


