CNC Condition Monitoring
Class Imbalance in CNC Condition Monitoring Data
Why healthy cycles usually outnumber anomalies, how accuracy becomes misleading, and what to measure instead.
Factories produce many healthy cycles and relatively few verified failures. That is good for production and difficult for machine learning.
The accuracy trap
If 99 of 100 cycles are healthy, predicting healthy every time is 99% accurate and detects nothing.
Training choices
Class weights, careful sampling and anomaly-detection methods can help. Synthetic data should not replace real validation.
Evaluation choices
Keep a test set that reflects the intended use, and report confusion counts alongside summary metrics.
Operational cost
A missed event and a nuisance alarm have different costs. Choose thresholds with maintenance capacity and risk in mind.
Why accuracy can lie
In 10,000 cycles with 20 anomalies, an always-healthy classifier reaches 99.8 percent accuracy and finds zero anomalies.
Report the 20 anomaly outcomes directly, along with false alarms among healthy cycles. Maintenance teams experience counts and alarm frequency, not accuracy alone.
| Metric | Question |
| Recall | How many known anomalies were detected? |
| Precision | How many alerts were relevant? |
| False alarms/day | Can the team handle the workload? |
Common mistakes to avoid
- Balancing the test set artificially.
- Reporting accuracy alone.
- Generating synthetic faults without real validation.
Frequently asked questions
Is ROC AUC enough?
Not by itself; precision-recall and operational counts can be more informative.
Should rare classes be oversampled?
Possibly in training, but keep grouped splits and an honest test distribution.
What threshold should be used?
One chosen from risk, recall and acceptable alarm burden.
Practical workflow for this method
Design evaluation around the maintenance decision. Count known anomalies detected, anomalies missed, false alerts and healthy cycles passed. Convert false alerts into an operational rate such as alerts per machine-day or per thousand cycles. This tells the team whether the workload is practical.
Do not make the final test set artificially balanced unless the real deployment is balanced. A 50/50 laboratory test can hide how precision collapses when anomalies are rare. Training may use weights or sampling, but evaluation should preserve the intended operating prevalence or clearly report an adjusted scenario.
Review errors by machine, operation and date. A model with acceptable overall recall may miss every anomaly on one machine. Aggregate metrics should never hide a complete subgroup failure.
About the data used in this guide
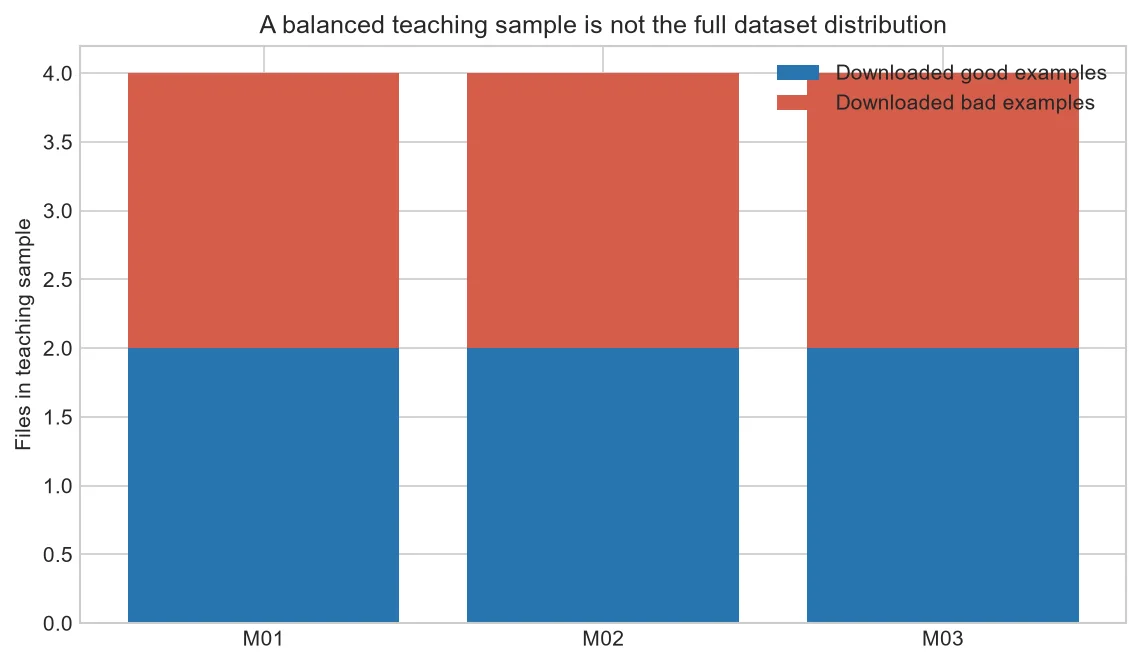
The charts use a small teaching sample selected from machines M01, M02 and M03, primarily operations OP01 and OP02. The source records tri-axial acceleration at 2 kHz and labels available examples as good or bad. Label coverage is uneven across machine-operation groups, so missing groups are not treated as healthy evidence. These figures are transparent worked examples, not population estimates or universal fault thresholds.
Dataset: CNC Machining Data, CC BY 4.0. Recommended citation: Tnani, Mohamed-Ali; Feil, Michael; Diepold, Klaus. Smart Data Collection System for Brownfield CNC Milling Machines: A New Benchmark Dataset for Data-Driven Machine Monitoring. Procedia CIRP 107 (2022), 131–136. Research paper.
We explain what the selected data supports and avoid naming a mechanical fault when the dataset only provides a good/bad process label. A machine should be inspected by a qualified person before maintenance or safety decisions are made.


