CNC Condition Monitoring
Feature Correlation Before Building a CNC Monitoring Model
Read a vibration-feature correlation matrix, find redundant variables and avoid conclusions based on a small mixed dataset.
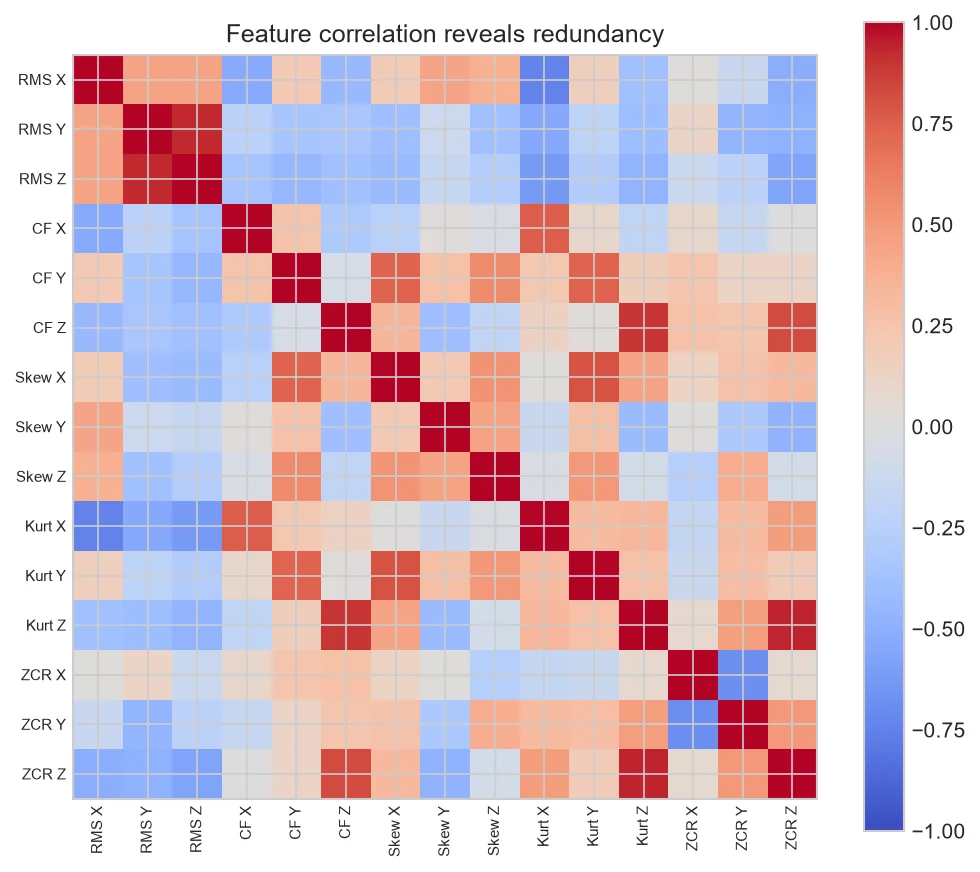
A feature correlation matrix shows which measurements move together in the available records. It is a useful audit for redundancy and pipeline errors, but correlation can change when machines, operations or labels are mixed.
Why correlated features appear
Several RMS-like measures may describe the same energy change. Mathematical dependence is expected and does not mean either calculation is wrong.
Mixing groups can mislead
A strong fleet-wide relationship may arise because machines have different baselines. Within each machine the same pair can be weak or even move differently.
Correlation is not agreement
Two features can correlate while using different scales and biases. Nor does correlation establish that one feature causes the other or that either predicts condition.
Use the matrix to simplify
When two features are consistently redundant, keep the one with better repeatability, interpretation, acquisition cost or sensitivity to the intended change.
Audit a suspicious feature pair
Open a scatterplot, color by operation and shape by machine. Calculate both Pearson and rank correlation, then repeat within groups.
If the relationship comes from only one outlier or group boundary, do not redesign the feature set around the overall coefficient.
| Finding | Next step |
| Strong linear pair | Check redundancy |
| Curved pattern | Use scatterplot or nonlinear measure |
| Group-dependent sign | Model context explicitly |
| Unexpected perfect match | Audit duplicate calculations |
Common mistakes to avoid
- Reading causation from correlation.
- Using only the combined fleet matrix.
- Deleting features before validation.
Frequently asked questions
What correlation is too high?
There is no universal cutoff; consider model type, stability and interpretation.
Is Pearson enough?
It captures linear association; rank and visual checks can reveal other behavior.
Can labels create correlation?
Yes, mixing separated classes can produce a relationship absent within either class.
Practical workflow for this method
Estimate correlation uncertainty with grouped resampling rather than treating the small-sample coefficient as exact.
Run the same audit after every feature-pipeline revision. Unexpected correlation changes can expose unit, filtering or indexing errors.
About the data used in this guide
The charts use a small teaching sample selected from machines M01, M02 and M03, primarily operations OP05 and OP06. The source records tri-axial acceleration at 2 kHz and labels available examples as good or bad. Label coverage is uneven across machine-operation groups, so missing groups are not treated as healthy evidence. These figures are transparent worked examples, not population estimates or universal fault thresholds.
Dataset: CNC Machining Data, CC BY 4.0. Recommended citation: Tnani, Mohamed-Ali; Feil, Michael; Diepold, Klaus. Smart Data Collection System for Brownfield CNC Milling Machines: A New Benchmark Dataset for Data-Driven Machine Monitoring. Procedia CIRP 107 (2022), 131–136. Research paper.
We explain what the selected data supports and avoid naming a mechanical fault when the dataset only provides a good/bad process label. A machine should be inspected by a qualified person before maintenance or safety decisions are made.


