CNC Condition Monitoring
Reading a CNC Monitoring Confusion Matrix Correctly
Translate true positives, false positives, true negatives and false negatives into practical CNC inspection consequences.
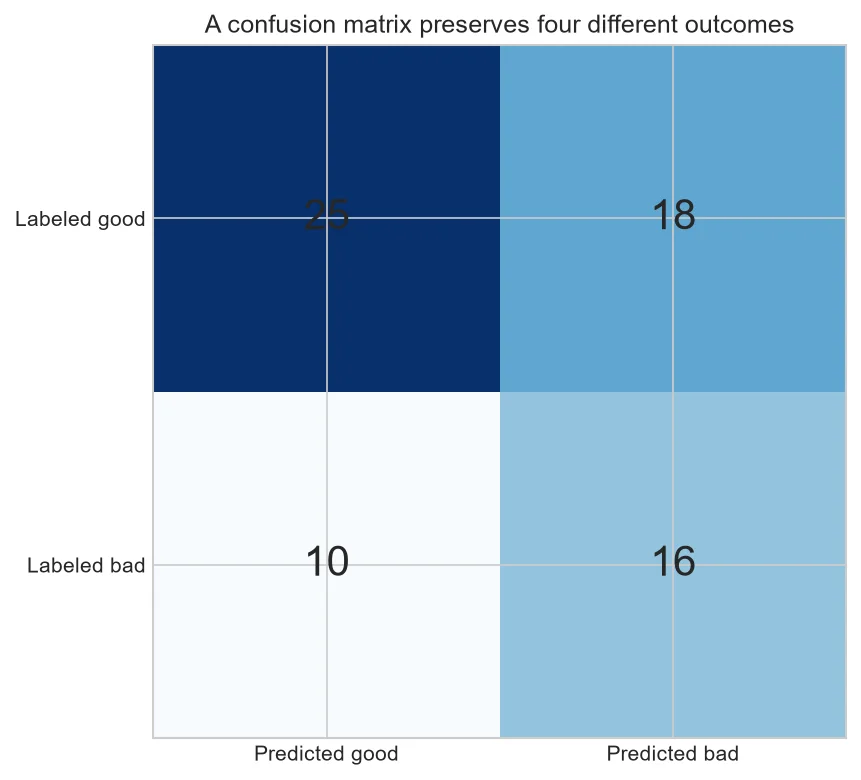
One accuracy number hides the errors that matter. A confusion matrix keeps correct decisions and two very different mistakes separate, making it easier to discuss workload and risk.
Name the four cells
A true positive flags a bad-labeled example; a false positive flags a good-labeled example; a true negative leaves a good one unflagged; a false negative misses a bad-labeled example.
Accuracy can mislead
If bad events are rare, predicting good every time may achieve high accuracy while detecting nothing. Precision, recall and false-alert rate expose different parts of the matrix.
Counts reveal workload
A one-percent false-alert rate can still overwhelm a plant with thousands of cycles. Convert rates to expected reviews per shift, day or machine-month.
Labels limit the conclusion
The Bosch files provide good/bad process labels, not confirmed diagnoses for a named mechanical fault. The matrix evaluates agreement with those labels only.
Turn cells into operating questions
Ask how long a false positive takes to review and what a false negative could delay. Then choose metrics and thresholds that reflect those asymmetric costs.
Break the matrix down by machine and operation. A good overall total can hide failure on one important group.
| Cell | Operational question |
| True positive | Was useful evidence caught? |
| False positive | How much review work was created? |
| True negative | Was ordinary production left alone? |
| False negative | What meaningful event was missed? |
Common mistakes to avoid
- Reporting accuracy alone.
- Reversing the positive class.
- Combining train and test predictions.
Frequently asked questions
Should counts be normalized?
Show both raw counts and rates when space allows.
Which cell is most serious?
It depends on safety, failure speed and inspection cost.
Can one matrix represent a fleet?
Only if subgroup performance is also checked.
Practical workflow for this method
Attach confidence intervals or grouped resampling estimates when test counts are small.
Preserve abstentions and rejected sensor records as separate outcomes instead of forcing them into good or bad.
About the data used in this guide
The charts use a small teaching sample selected from machines M01, M02 and M03, across the available OP01–OP06 files. The source records tri-axial acceleration at 2 kHz and labels available examples as good or bad. Label coverage is uneven across machine-operation groups, so missing groups are not treated as healthy evidence. These figures are transparent worked examples, not population estimates or universal fault thresholds.
Dataset: CNC Machining Data, CC BY 4.0. Recommended citation: Tnani, Mohamed-Ali; Feil, Michael; Diepold, Klaus. Smart Data Collection System for Brownfield CNC Milling Machines: A New Benchmark Dataset for Data-Driven Machine Monitoring. Procedia CIRP 107 (2022), 131–136. Research paper.
We explain what the selected data supports and avoid naming a mechanical fault when the dataset only provides a good/bad process label. A machine should be inspected by a qualified person before maintenance or safety decisions are made.


